You really should use debuggers
debuggers dap lspThis a post about something near and dear to my heart: Debuggers.
In this post, we are going to explain why you should use a debugger, what they are, and how to set them up in your favorite editor (whether that is vscode, neovim, emacs, or any other editor).
I believe that quality matters and that by understanding this incredible tool you’ll not only have a better time programming, you’ll produce better code which is better for the world.
Why use a debugger?
If you aren’t using a debugger, you are skiing with one boot on and there isn’t snow.
Debugging without a debugger is often referred to as caveperson debugging because it is unsightly and about as effective as hitting a computer with a club and expecting a meal.
Print statements and console logs are comically ineffective compared to running a debugger.
If you are relying on console.log("help me") and print("help me please") you are programming like this:
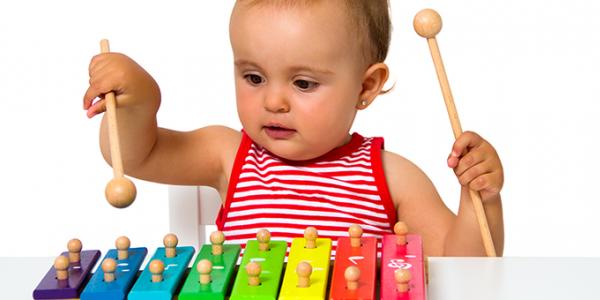
Once you learn to use your debugger, you will feel more like this:
Better for debugging
A debugger lets you stop your code in place and inspect (or change) anything you want.
This gives you incredible levels of insight and control over your programs. Bug finding and correction become massively more efficient.
Better for learning
If you are jumping into an existing project at work or contributing to an open source project, using the debugger is one of the most efficient ways to become familiar with a new codebase. You can simply run the debugger and watch the code execute step-by-step and quickly develop a sense of how the program functions.
Why doesn’t everyone use them?
Setting them up can be tricky and be frustrating, especially if you don’t understand what they are doing. Fortunately once you understand how they work, setting them up and using them is easy.
Is learning to use a debugger worth it in the age of AI and Vibe Code?
Absolutely, in fact I would say learning to use a debugger is even more important in the age of AI and Vibe Code. It is the most efficient way to understand your vibe code and to pinpoint issues that you or your AI minions can fix. Using AI for programming is usually smart but it puts you in a position where reviewing and understanding the AI generated code is all the more important.
What is a debugger?
A debugger is a different runtime process for your program.
In normal person language, instead of running your program using “python” or “node” or whatever other command you’re using, you run your program using that language’s debugger.
Running them is often as simple as doing python -m pdb myProj.py instead of python myProj.py or node inspect myScript.js instead of node myScript.js.
Key Point: A debugger is usually a part of the language package installed on your computer
An analogy: Executing code with the debugger is like running your program in its own special container. The container has its own behavior and tooling that allow you to pause and inspect code while the program runs.
Thus when you run a debugger, the debugger loads your program, instruments magical hooks and monitors (giving you the ability to inspect variables normally hidden in a maze of memory), and manages your program’s execution (allowing you to pause and step through code).
What about the debugger in my IDE?
Your IDE does not have a debugger. It just has a UI that uses the underlying language’s debugger.
There is no difference in the debugger whether you run it in vscode, terminal, emacs, neovim, or some other editor. In almost every case, all editors rely on the same underlying debug environment1.
Your launch.json file in vscode just instructs vscode on how to run the language’s builtin debugger using something called DAP (debugger adapter protocol), but more on that later.
Key Takeaway: A debugger is a part of (or an add-on to) the programming language, not a part of your editor
Debugger Commands
Debuggers use a standard set of commands that let you navigate your code while debugging. You don’t need to remember all of them but here is a primer that will cover 90% of what you will do.
Navigation
- Set/Remove Breakpoint: Marks a line where execution should pause
- Continue/Resume: Proceeds until the next breakpoint
- Step Over: Executes the current line and stops at the next line
- Step Into: Moves into a function to let you debug its internal code
- Step Out: Finishes executing the current function and returns to the calling function
Inspection
- View Variables: Examine local and global variables in the current scope
- Watch Expression: Monitor specific variables or expressions as execution progresses
- Evaluate Expression: Execute arbitrary code in the current context
- Call Stack: View the hierarchy of function calls that led to the current point
Advanced
- Conditional Breakpoints: Pause execution only when a specified condition is true
- Change Variable Value: Modify a variable’s value during execution
- Restart: Reset debugging session without restarting the debugger
- Run to Cursor: Execute until reaching the line where the cursor is
Debugging in different editors
We are going to setup and use a debugger in python and javascript using the terminal, vscode, emacs, and neovim.
This should (A) drive home the point that debuggers are easy to use/setup and (B) give you a starting point regardless of your preferred editor.
For this next part ensure that you have python and/or javascript installed as these come with built-in debuggers. Some languages, like Go, require that you install a separate package such as delve to debug.
Setup
Let’s create a buggy python and javascript file and use their respective debuggers in different editors.
To start, open a terminal and create a sandbox:
# First create the directory structure
mkdir -p debugger/python debugger/js

# Then create some empty files
touch debugger/python/main.py debugger/js/main.js
Let’s cd debugger/python, open main.py and paste in the following code.
def calculate_sum(numbers):
    """Calculate the sum of a list of numbers."""
    total = 0
    for i in range(len(numbers)):
        if i < len(numbers) - 1:
            total += numbers[i]
    return total

def main():
    # Test the function with different inputs
    test_data = [10, 20, 30, 40, 50]
    result = calculate_sum(test_data)

    # Expected sum: 150, but we'll get 100 because of the bug
    print(f"Numbers: {test_data}")
    print(f"Expected: {150}")
    print(f"Actual: {result}")

    # Another test case
    more_numbers = [5, 15, 25, 35]
    another_result = calculate_sum(more_numbers)
    print(f"More numbers: {more_numbers}")
    print(f"Expected: {80}")
    print(f"Sum: {another_result}")

if __name__ == "__main__":
    main()
You can run this via python main.py. You should see some test results and an obvious problem.
Next, cd ../js/, open main.js and paste the following in:
function calculateAverage(numbers) {
    let sum = 0;
    let count = 0;

    for (let i = 1; i < numbers.length; i++) {
        sum += numbers[i];
        count++;
    }

    // Return the average
    return sum / count;
}

function main() {
    const testCase1 = [10, 20, 30, 40];
    console.log("Numbers:", testCase1);
    console.log("Expected: ", 25);
    console.log("Average:", calculateAverage(testCase1));

    const testCase2 = [100, 5, 10, 15];
    console.log("Numbers:", testCase2);
    console.log("Expected: ", 32.5);
    console.log("Average:", calculateAverage(testCase2));
}

main();
Similarly, running this via node main.js will render test results and a problem.
How would you debug these using print statements?
“I suppose you could inject your print statement into the for loop and then watch it print.”
What if the bug only occurs in some cases or the list is really large?
“I guess you could add an if-block in your code to print only when…”
This is not efficient and might introduce undesirable side effects. The bug might not even be where you expect it, requiring you to run the program multiple times while moving your print statements around blindly.
Instead, let’s use a debugger and set breakpoints to pause the code exactly where we think there is an issue.
Debugging in the terminal
Remember: Debugging is just executing your code with a different command. Since you can run your code in a terminal, you can run the debugger in the terminal as well. You might not do this much in real life, but it helps illustrate how debuggers work.
Below, I have our python code opened in neovim on the right and a normal terminal on the left. I’ve run python main.py to see the problem followed by python -m pdb main.py.
This started the python debugger which main.py as its argument.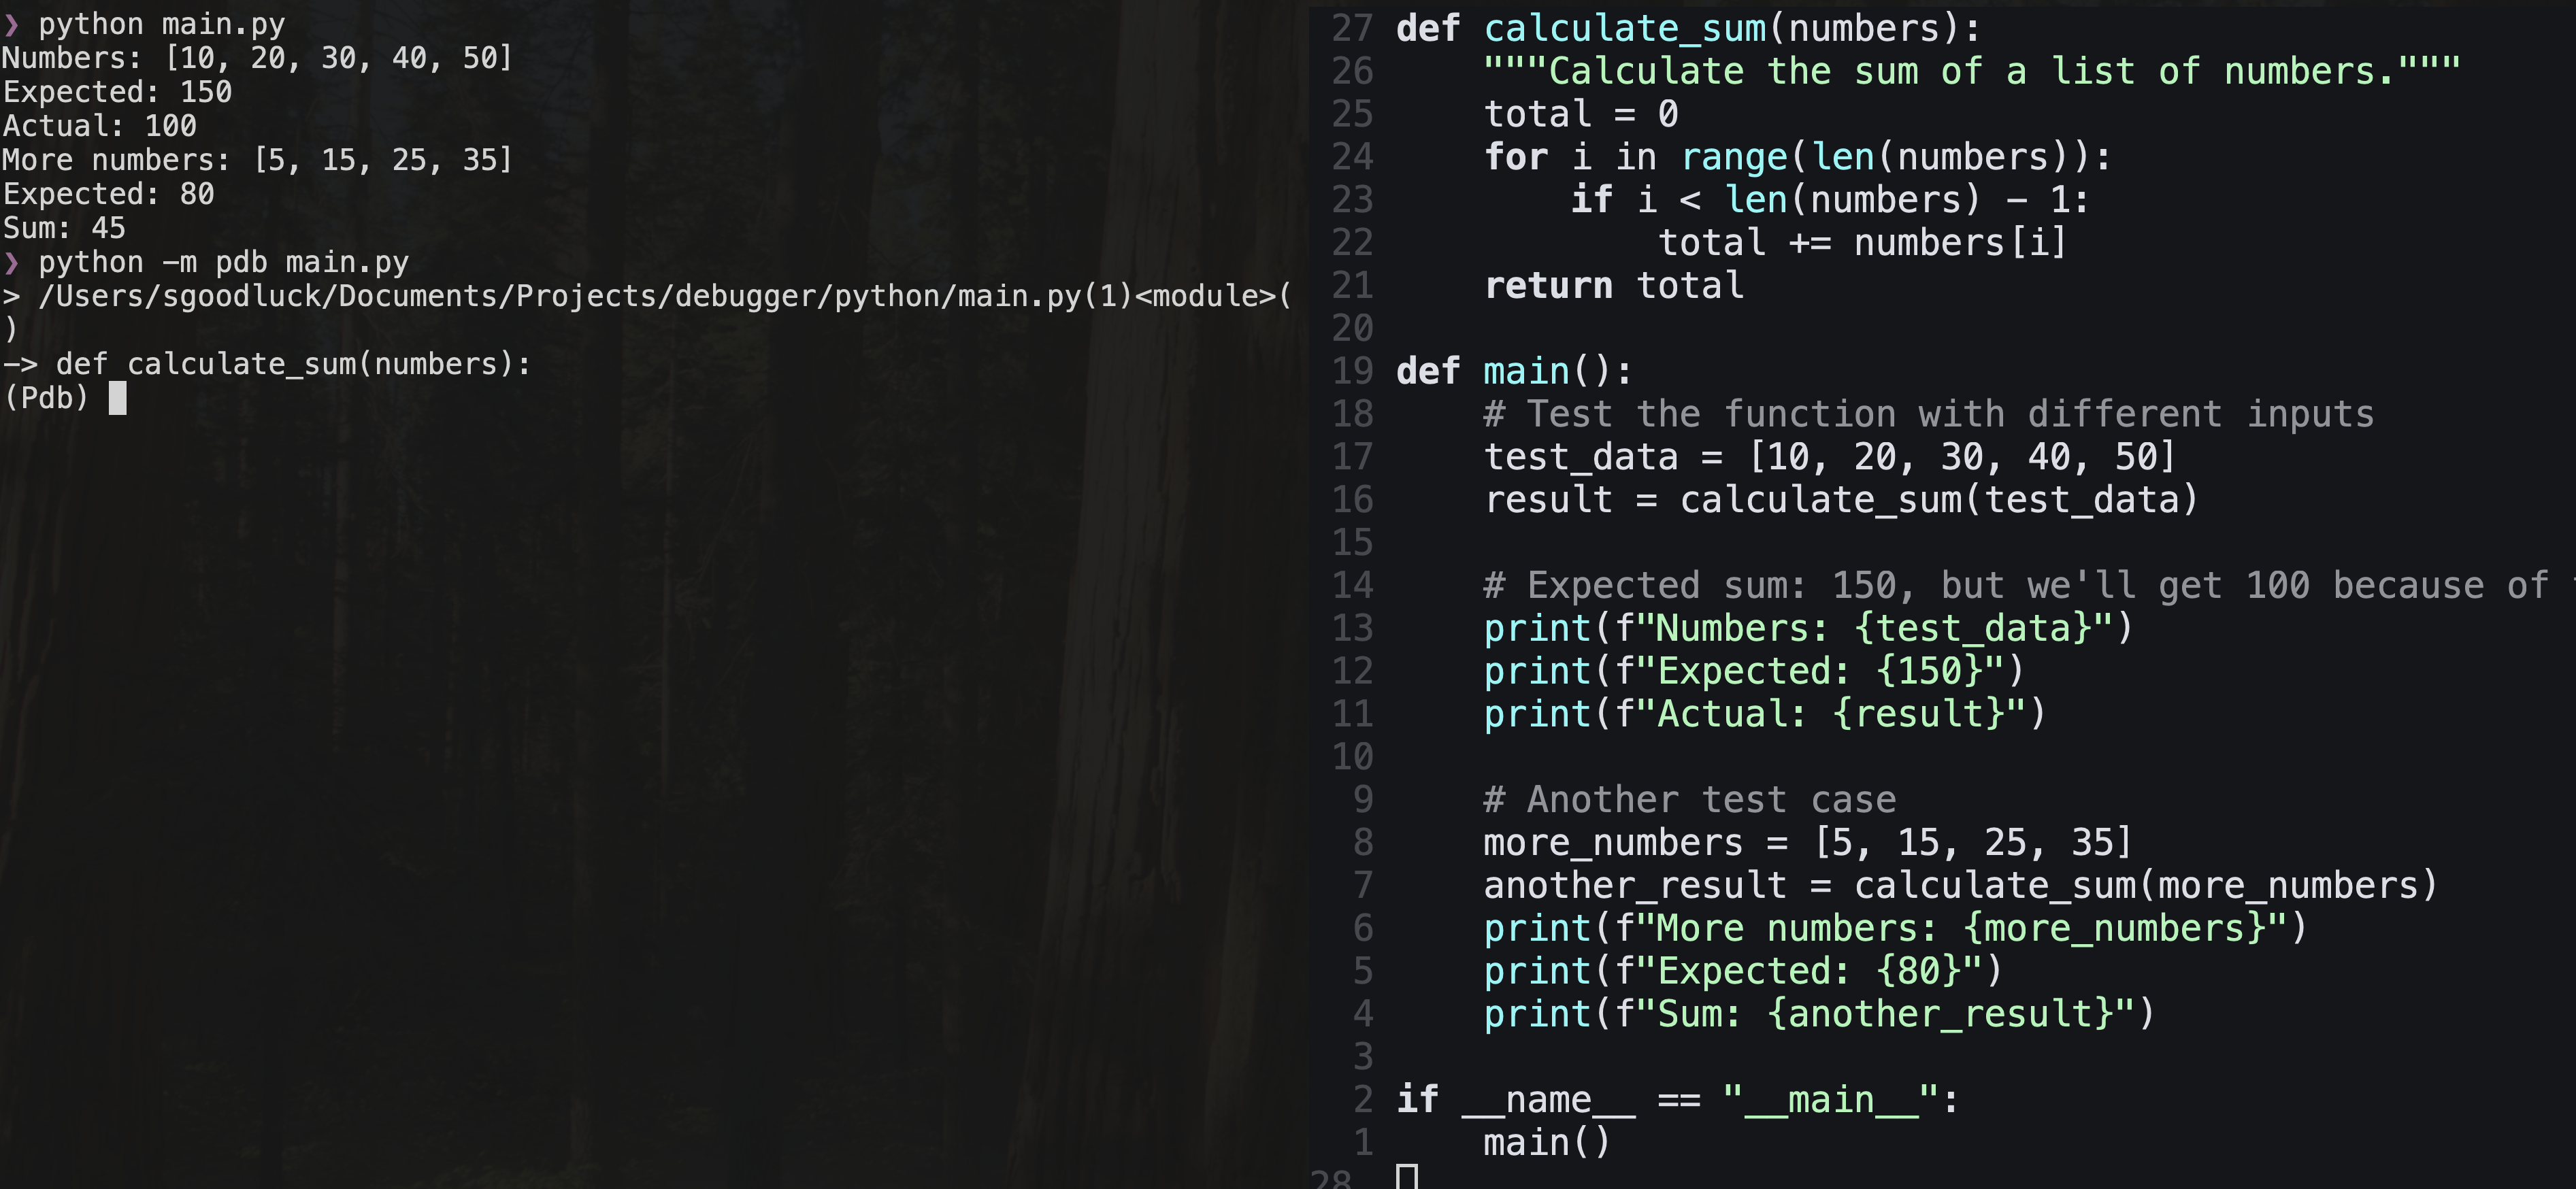
How do you use the python debugger in the terminal? In most debuggers, you can always type help or find a simple cheat sheet like this one.
Most debuggers use a mnemonic command system which is a fancy way of saying “use the first letter of an action to execute that action” (i.e. q means quit and b means breakpoint and c means continue and so on).
We can see what the python debugger printed the following lines:
> /Users/sgoodluck/Documents/Projects/debugger/python/main.py(1)<module>()
-> def calculate_sum(numbers):
(Pdb)
Line 1 tells us what file we are in and what line we are on. Line 2 has printed the line of code at this point. Line 3 is awaiting our next command.
Navigating code with the debugger
If we type n (for next) three times, we will get to main where the code actually starts. From here we can type s (for step into) to step-into the main() function.
We can keep using n until we get to the line we care about, in this case:
result = calculate_sum(test_data).
At this point we want to s (step into) calculate_sum(...). We caninspect the variable numbers using p (print) like so: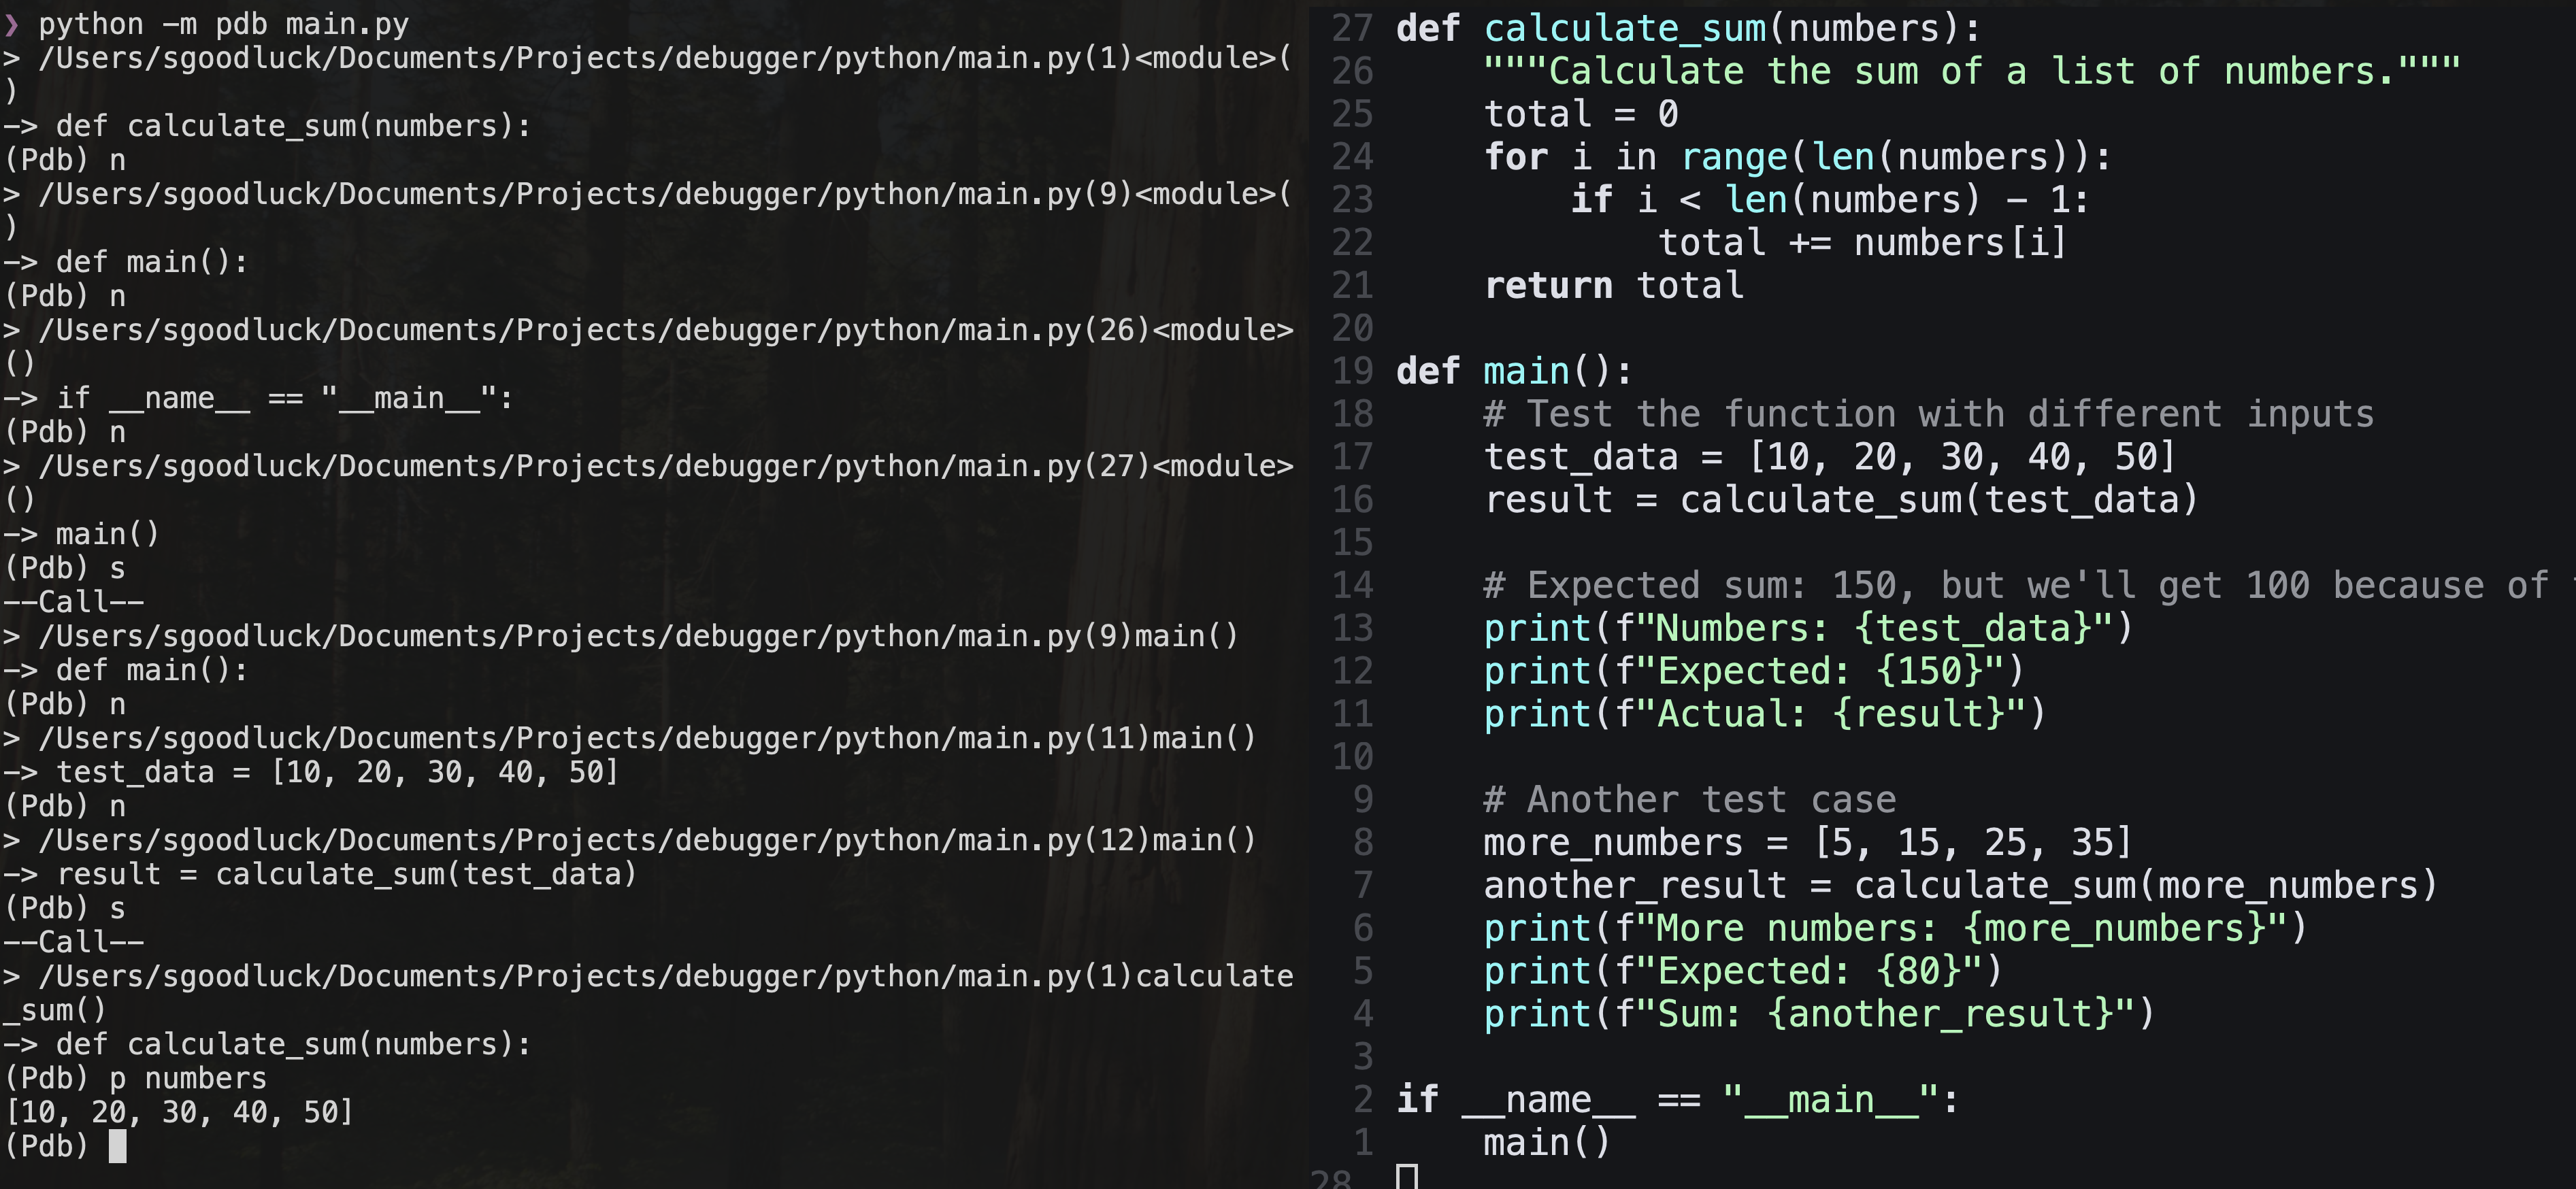
Using breakpoints
Stepping through code manually this way is tedious. Instead let’s use a breakpoint to pause code execution exactly when we want to.
Looking briefly at our test cases, we can see that our total variable seems to be too small.
Let’s add a breakpoint on line 6 where we are calculating this variable by using b 6 (toggle breakpoint at line 6).
Now, we can type c (for continue) which will run the code until it hits a breakpoint. At this point we the program has paused. We can inspect and change any variable in scope.
We want to watch the value of i and total, so we can use display i, total which instructs pdb to print these variables each time it pauses on the breakpoint.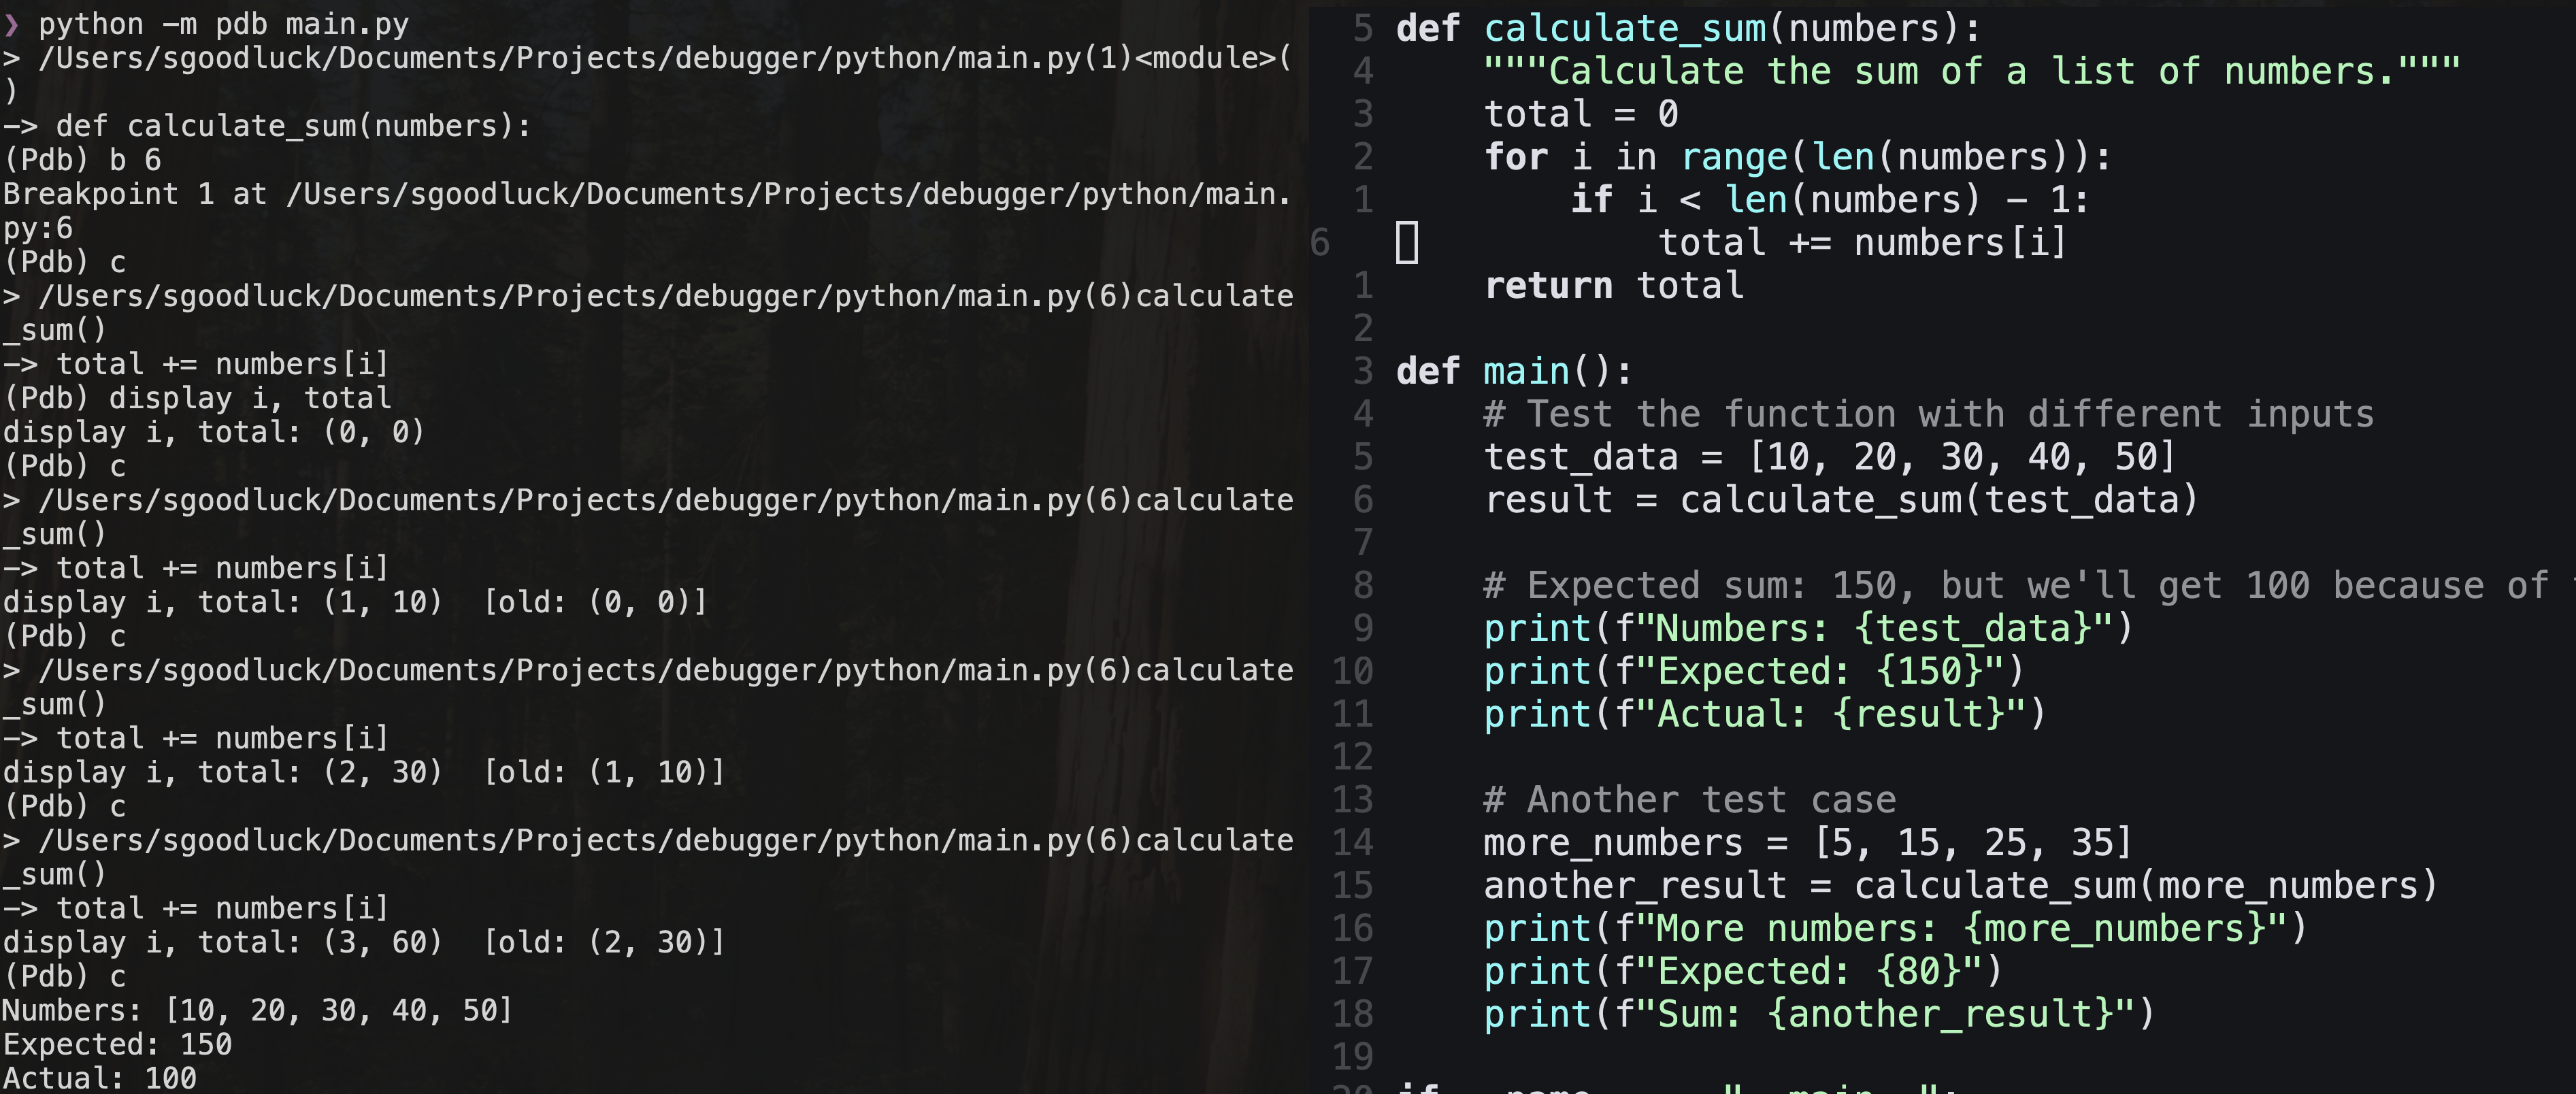
After c (continuing) a few times we can see that we broke out of our loop at index = 3 instead of index =4. Congratulations, we have discovered the bug!
We don’t want to subtract 1 on line 5. A quick correction and we can see that the code behaves as we expect.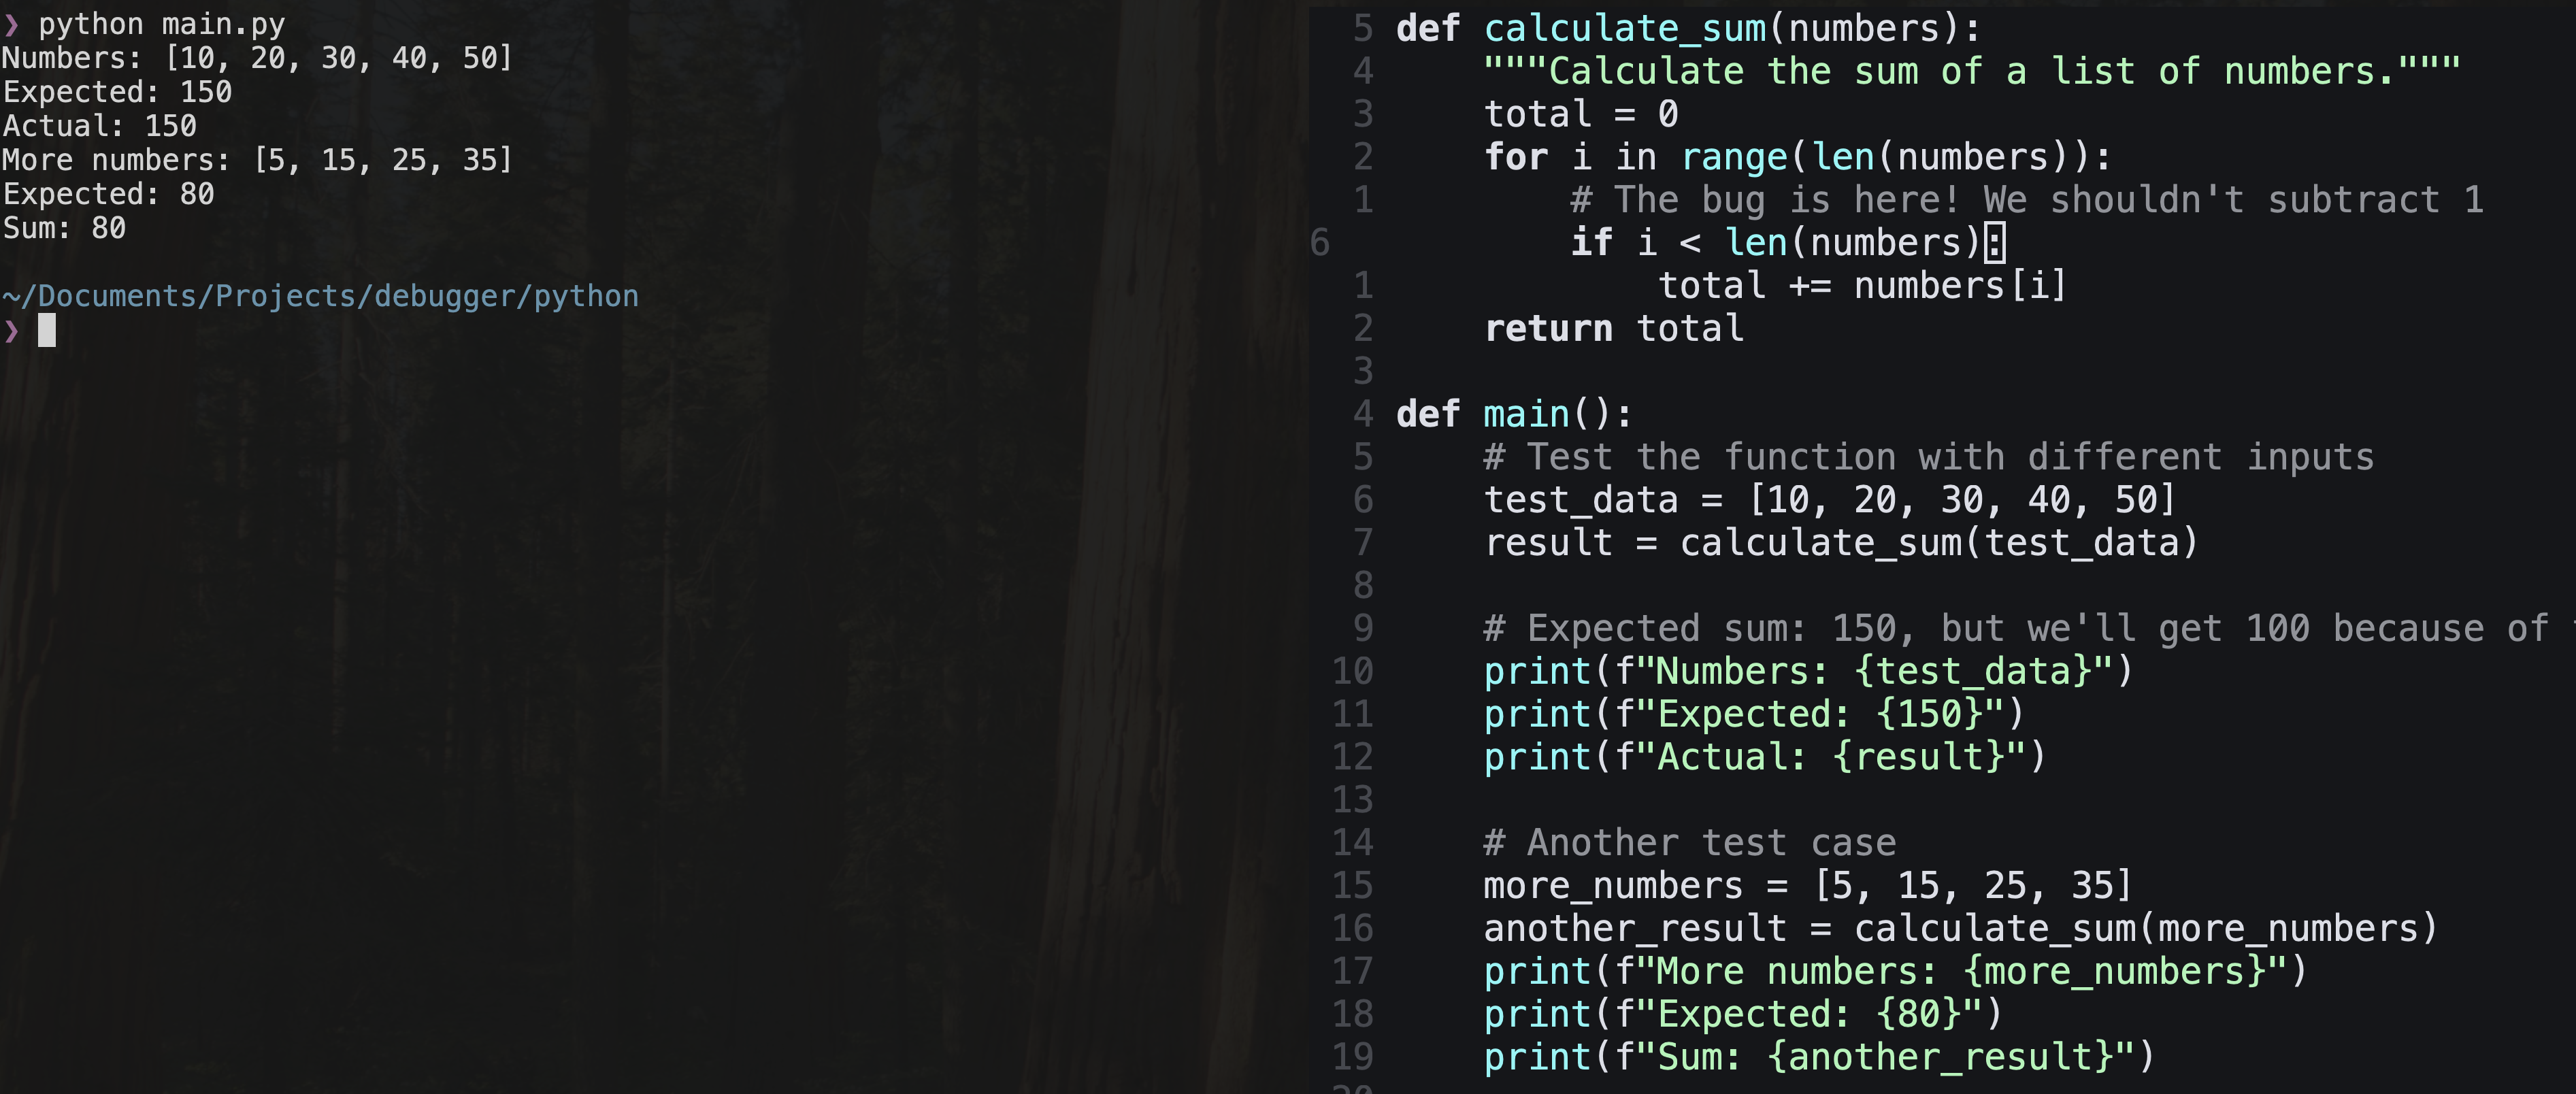
Terminal debugger with node
Here is an abbreviated version doing the same thing with our javascript code. A quick help command will show similar mnemonic commands.
In this case, setting a breakpoint uses sb(line #) and watching variables uses watch('variableName'). Remember, each language has its own debugger.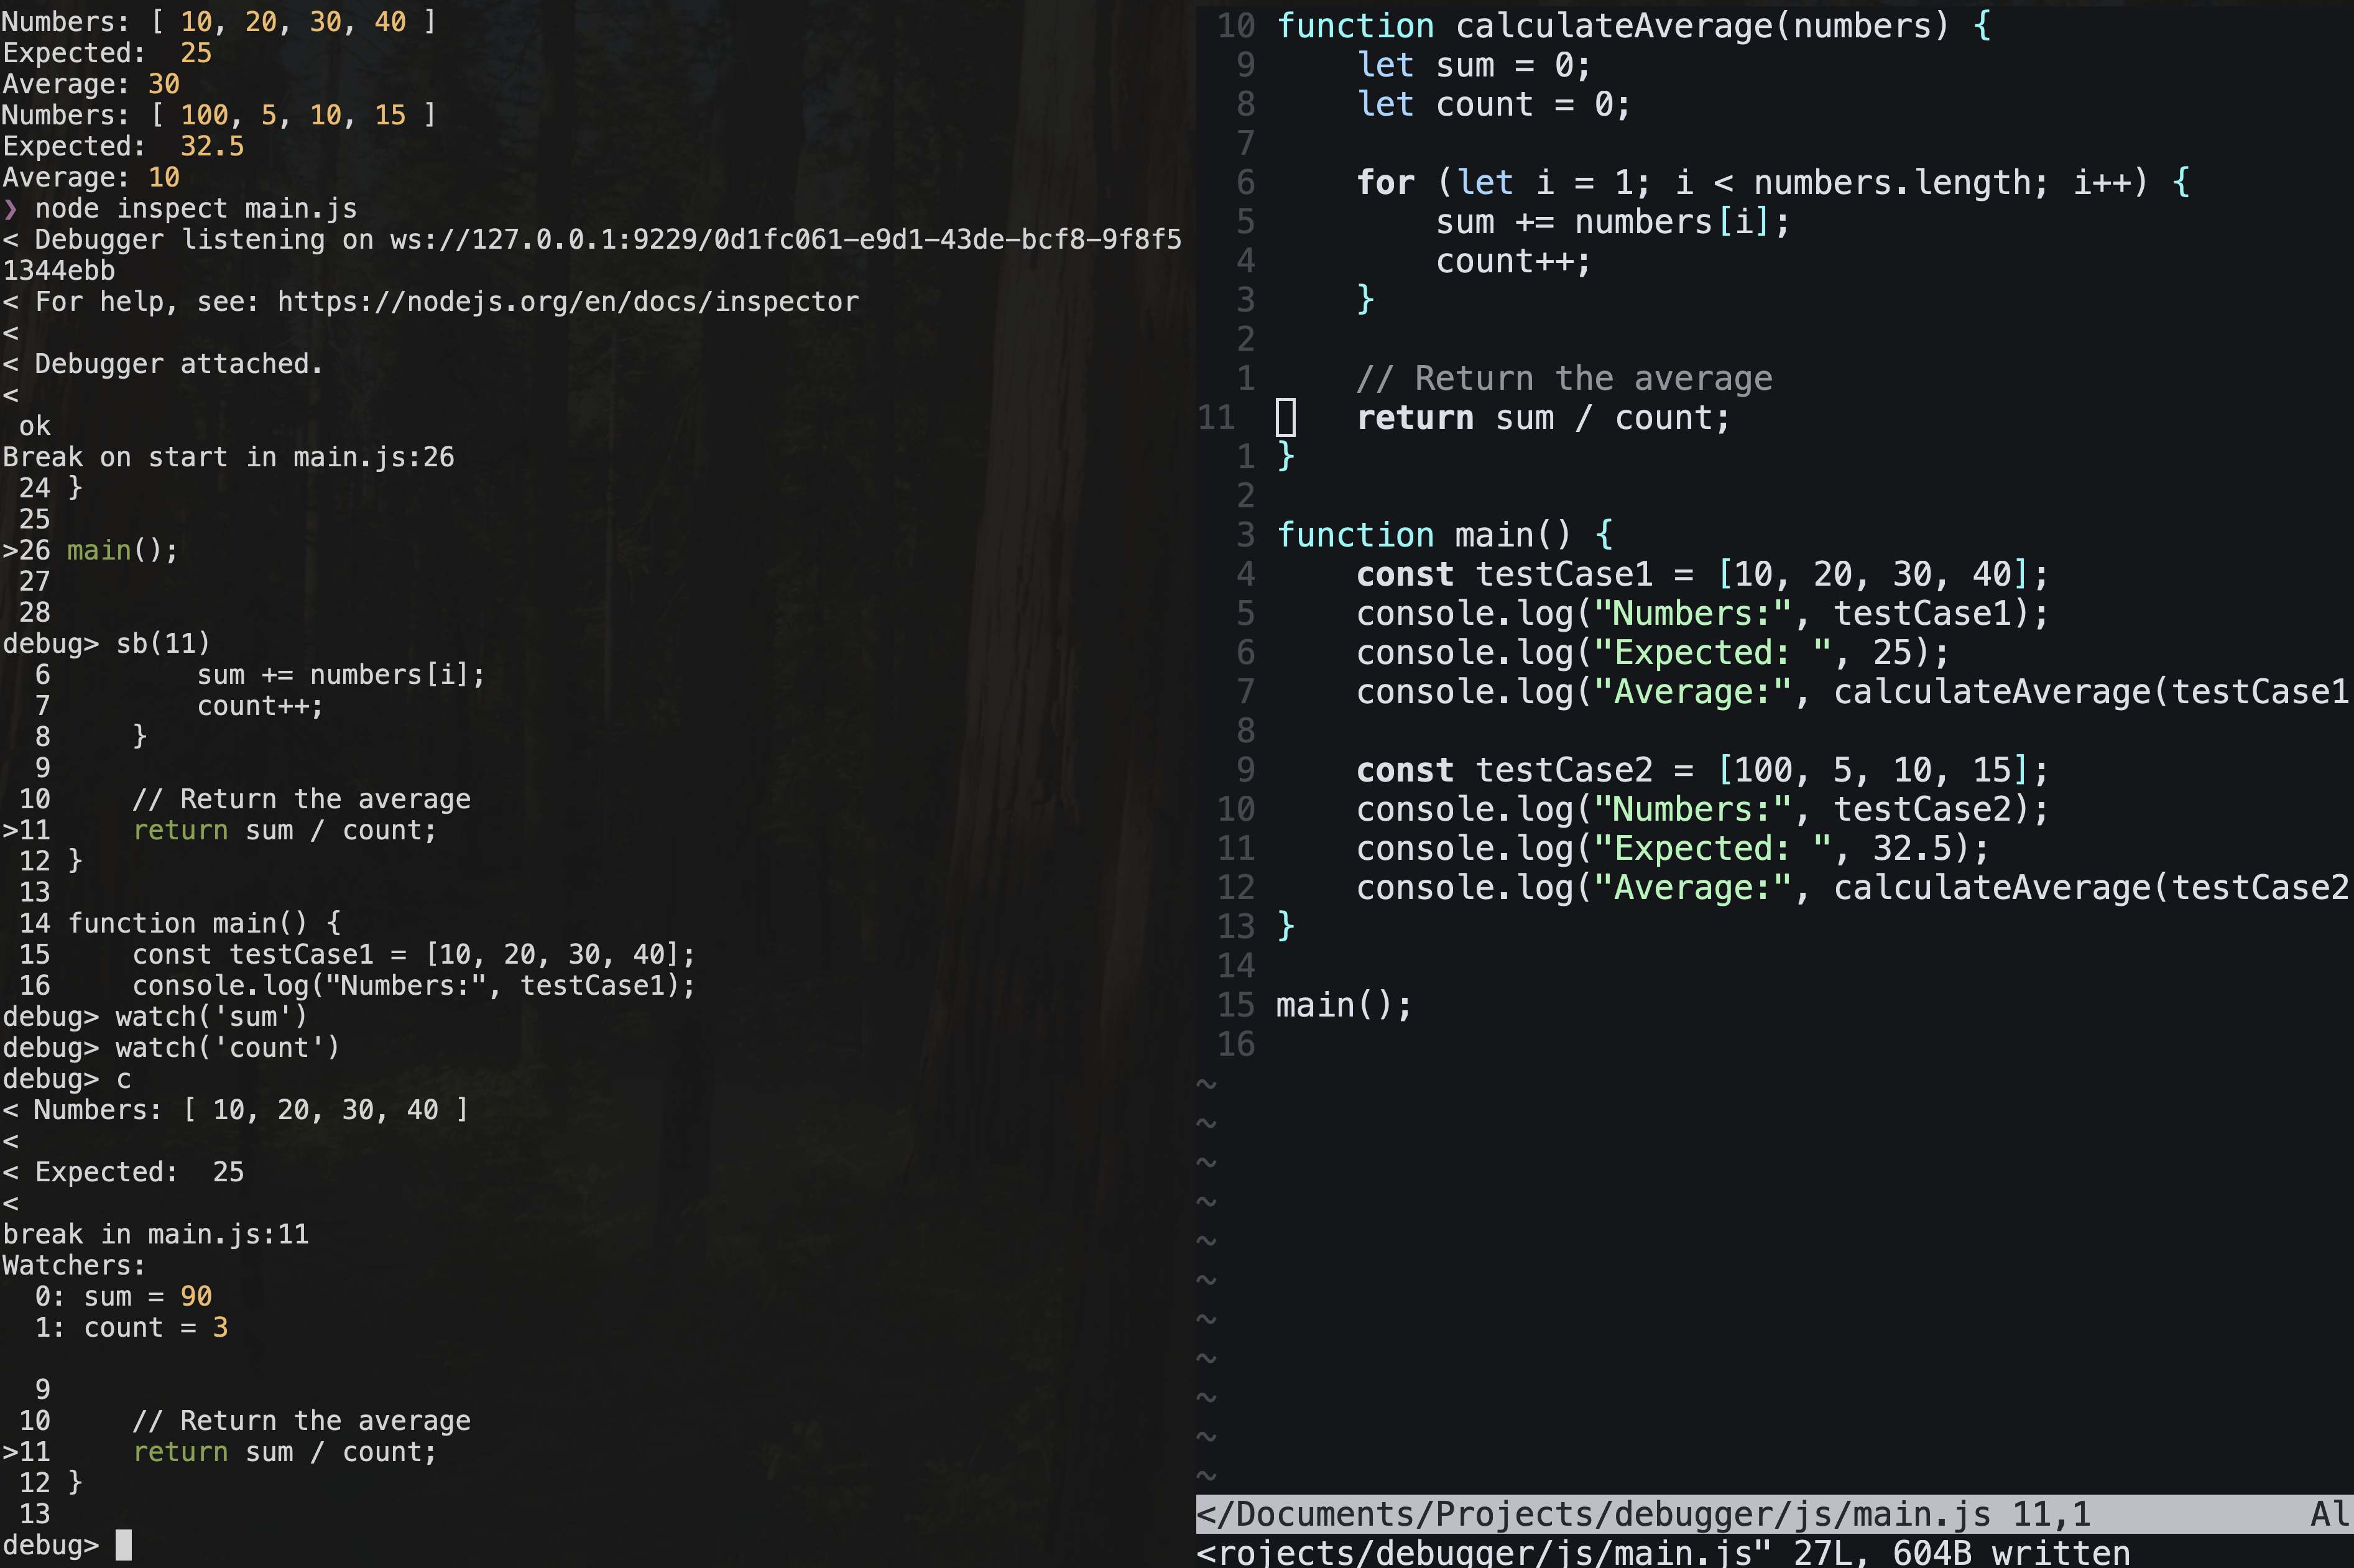
As before, we ran the code via node and saw something unexpected. So, we ran the code using the debugger via node inspect main.js.
We set a breakpoint on line 7 and set a watch on the sum and count variables.
One c (continue to next breakpoint) later and we finish our first test case and can see the value of those variables (which are incorrect). Can you spot the issue?
Debuggers are POWERFUL but using a debugger in the terminal is a bit of a drag most of the time. However, you should have a sense for how they work at this point.
DAP (debugger adapter protocol)
Remember how the terminal debugger looked different for python and javascript (e.g. b 6 in python vs sb(6) in javascript)?
That’s because they are different debuggers and have different APIs.
This is where DAP (debugger adapter protocol) comes in.
DAP acts as a unified API for most language debuggers meaning that IDEs like neovim and vscode only need to have a DAP integration to be able to use the different debuggers. Commonly, something a launch.json file handles how the IDE interacts with DAP
Debugging in vscode
vscode, like all major IDEs, hides what is really going on. Now you know that your IDE is running the language’s debugger under the hood while providing a visual UI to make it easier to use. vscode and most other editors use a configuration file that tells vscode how to interact with the underlying debugger using DAP (which is a unified API for debuggers).
Creating a launch.json file
Let’s open vscode to the same working directory as before. This time, click the “Debug” icon on the left panel. For illustrative purposes, instead of selecting a debugger, click the create a launch.json file link on the left side panel followed by Node.js.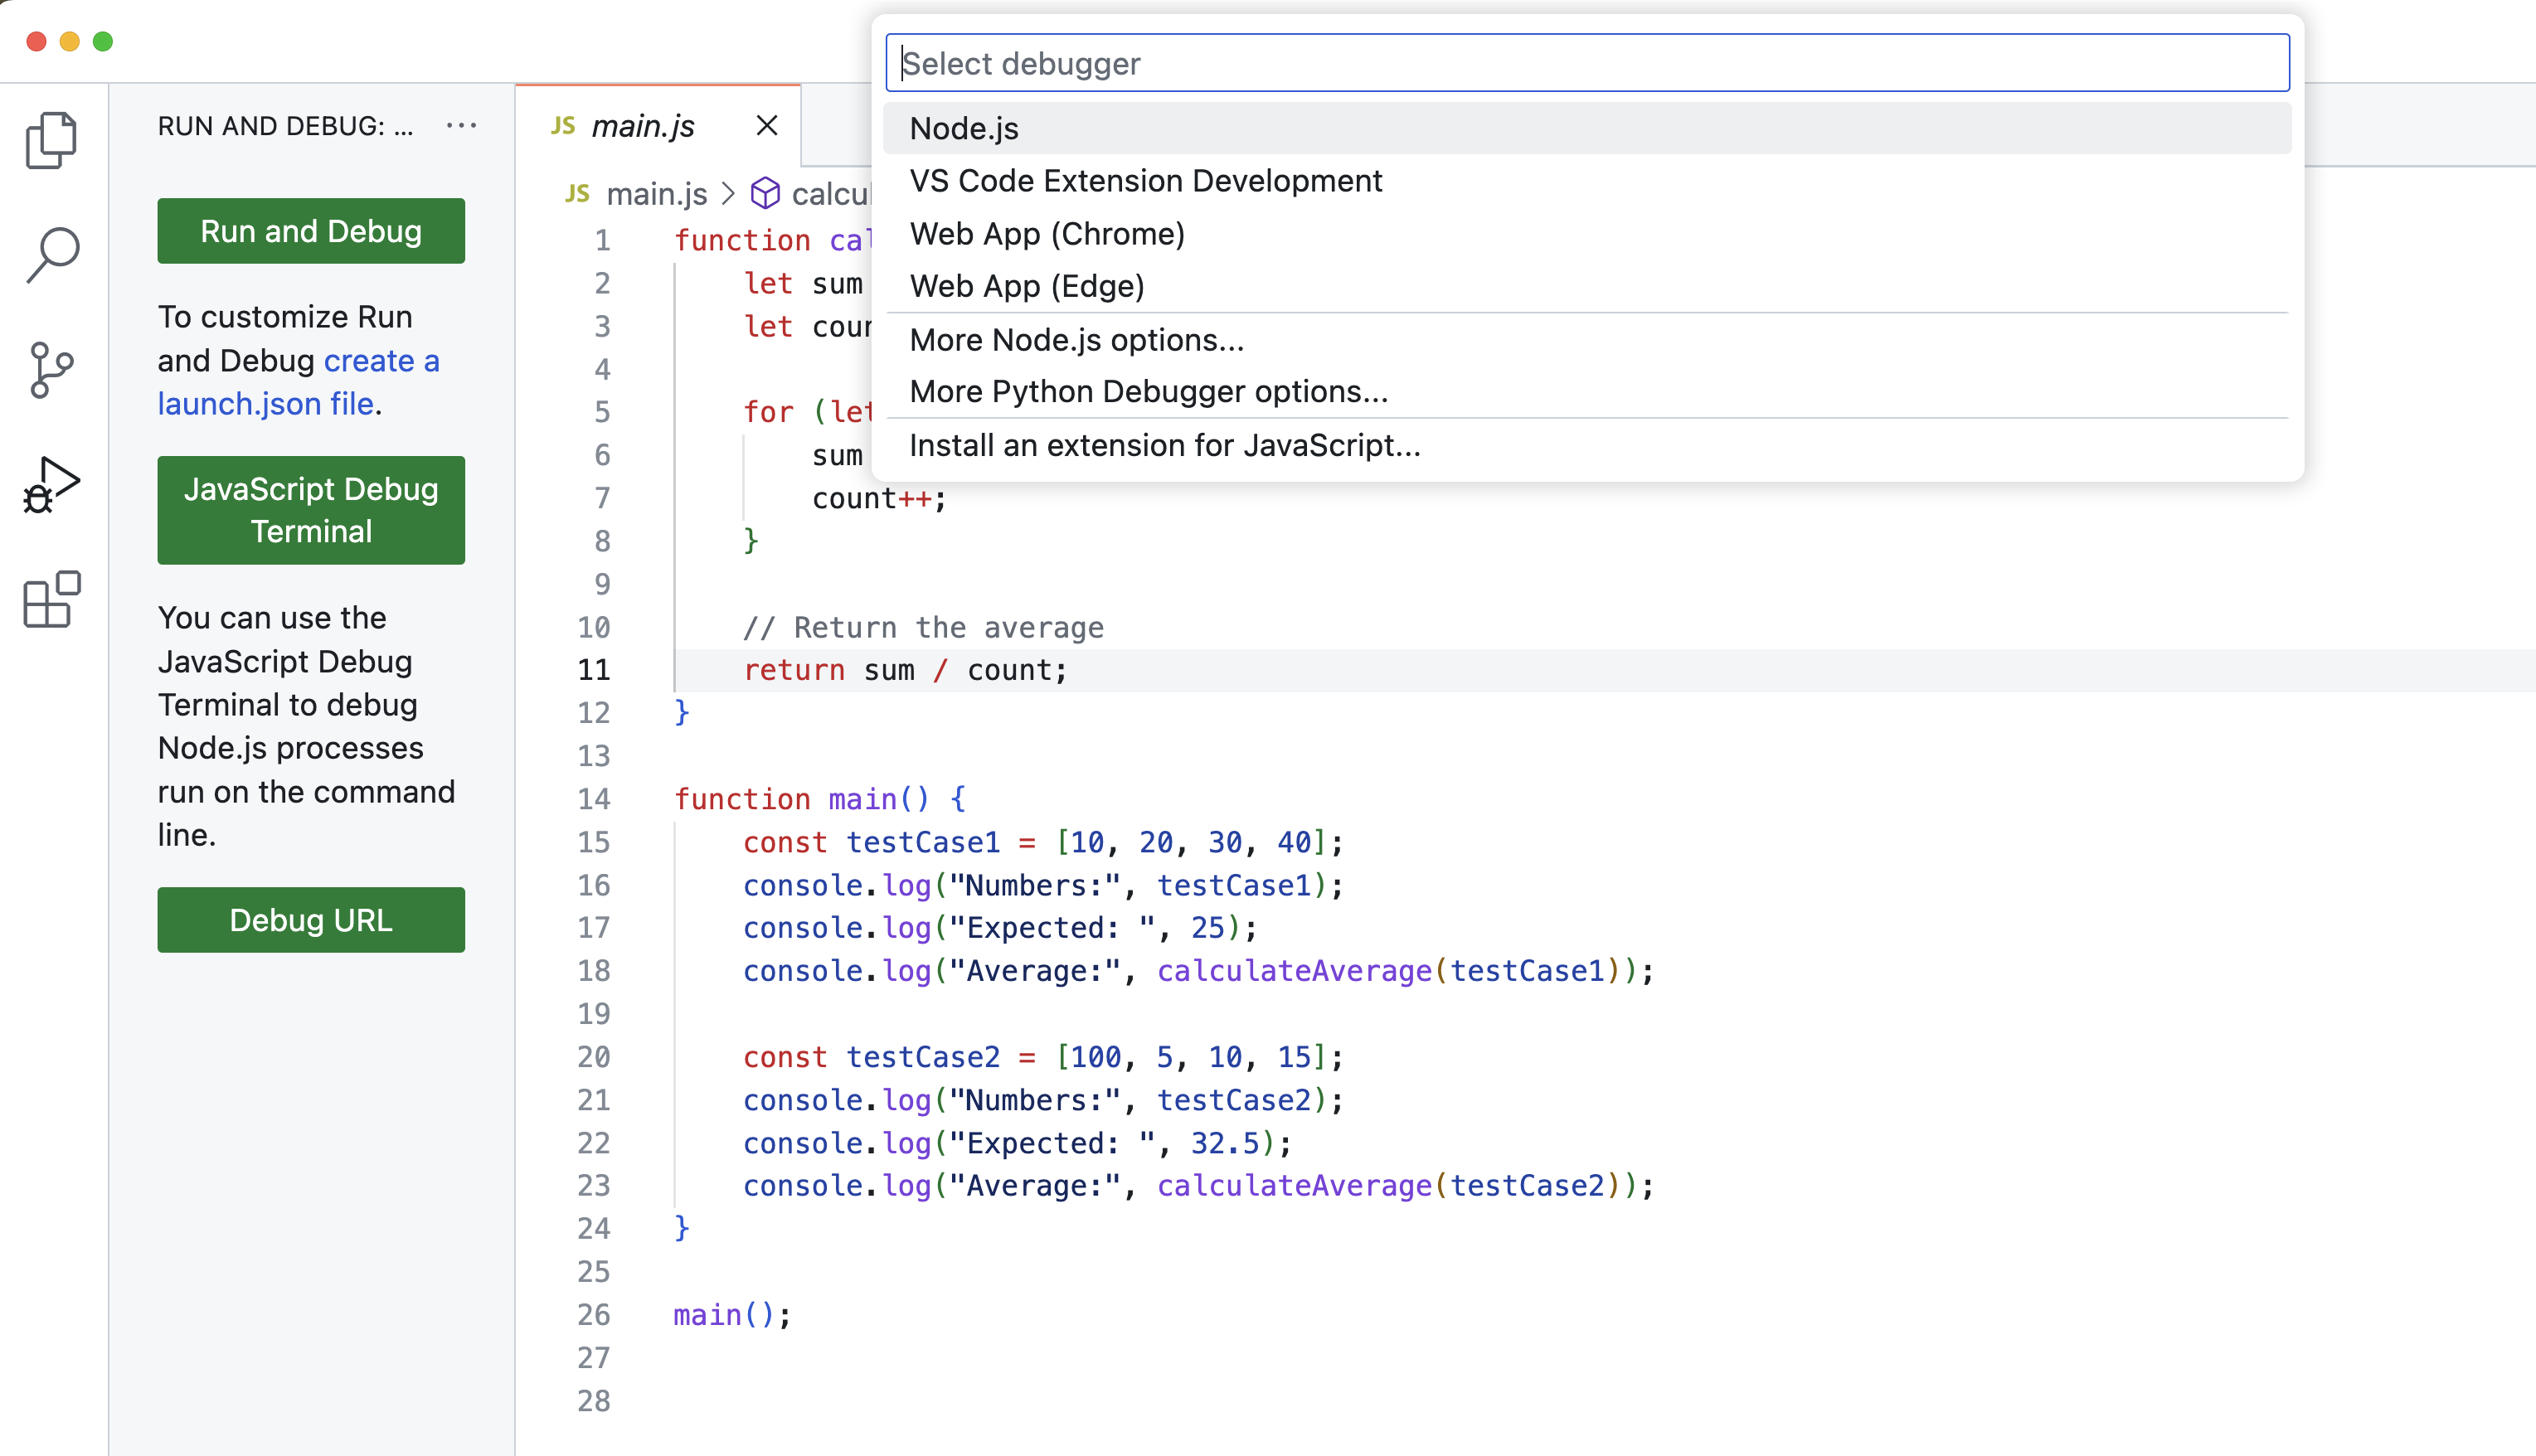
This will create a file called launch.json and prompt you through some menu options.
Select Node.js: Attach for now as this is the default. Fun fact, each menu item adjusts equivalent command line configurations (more on that later).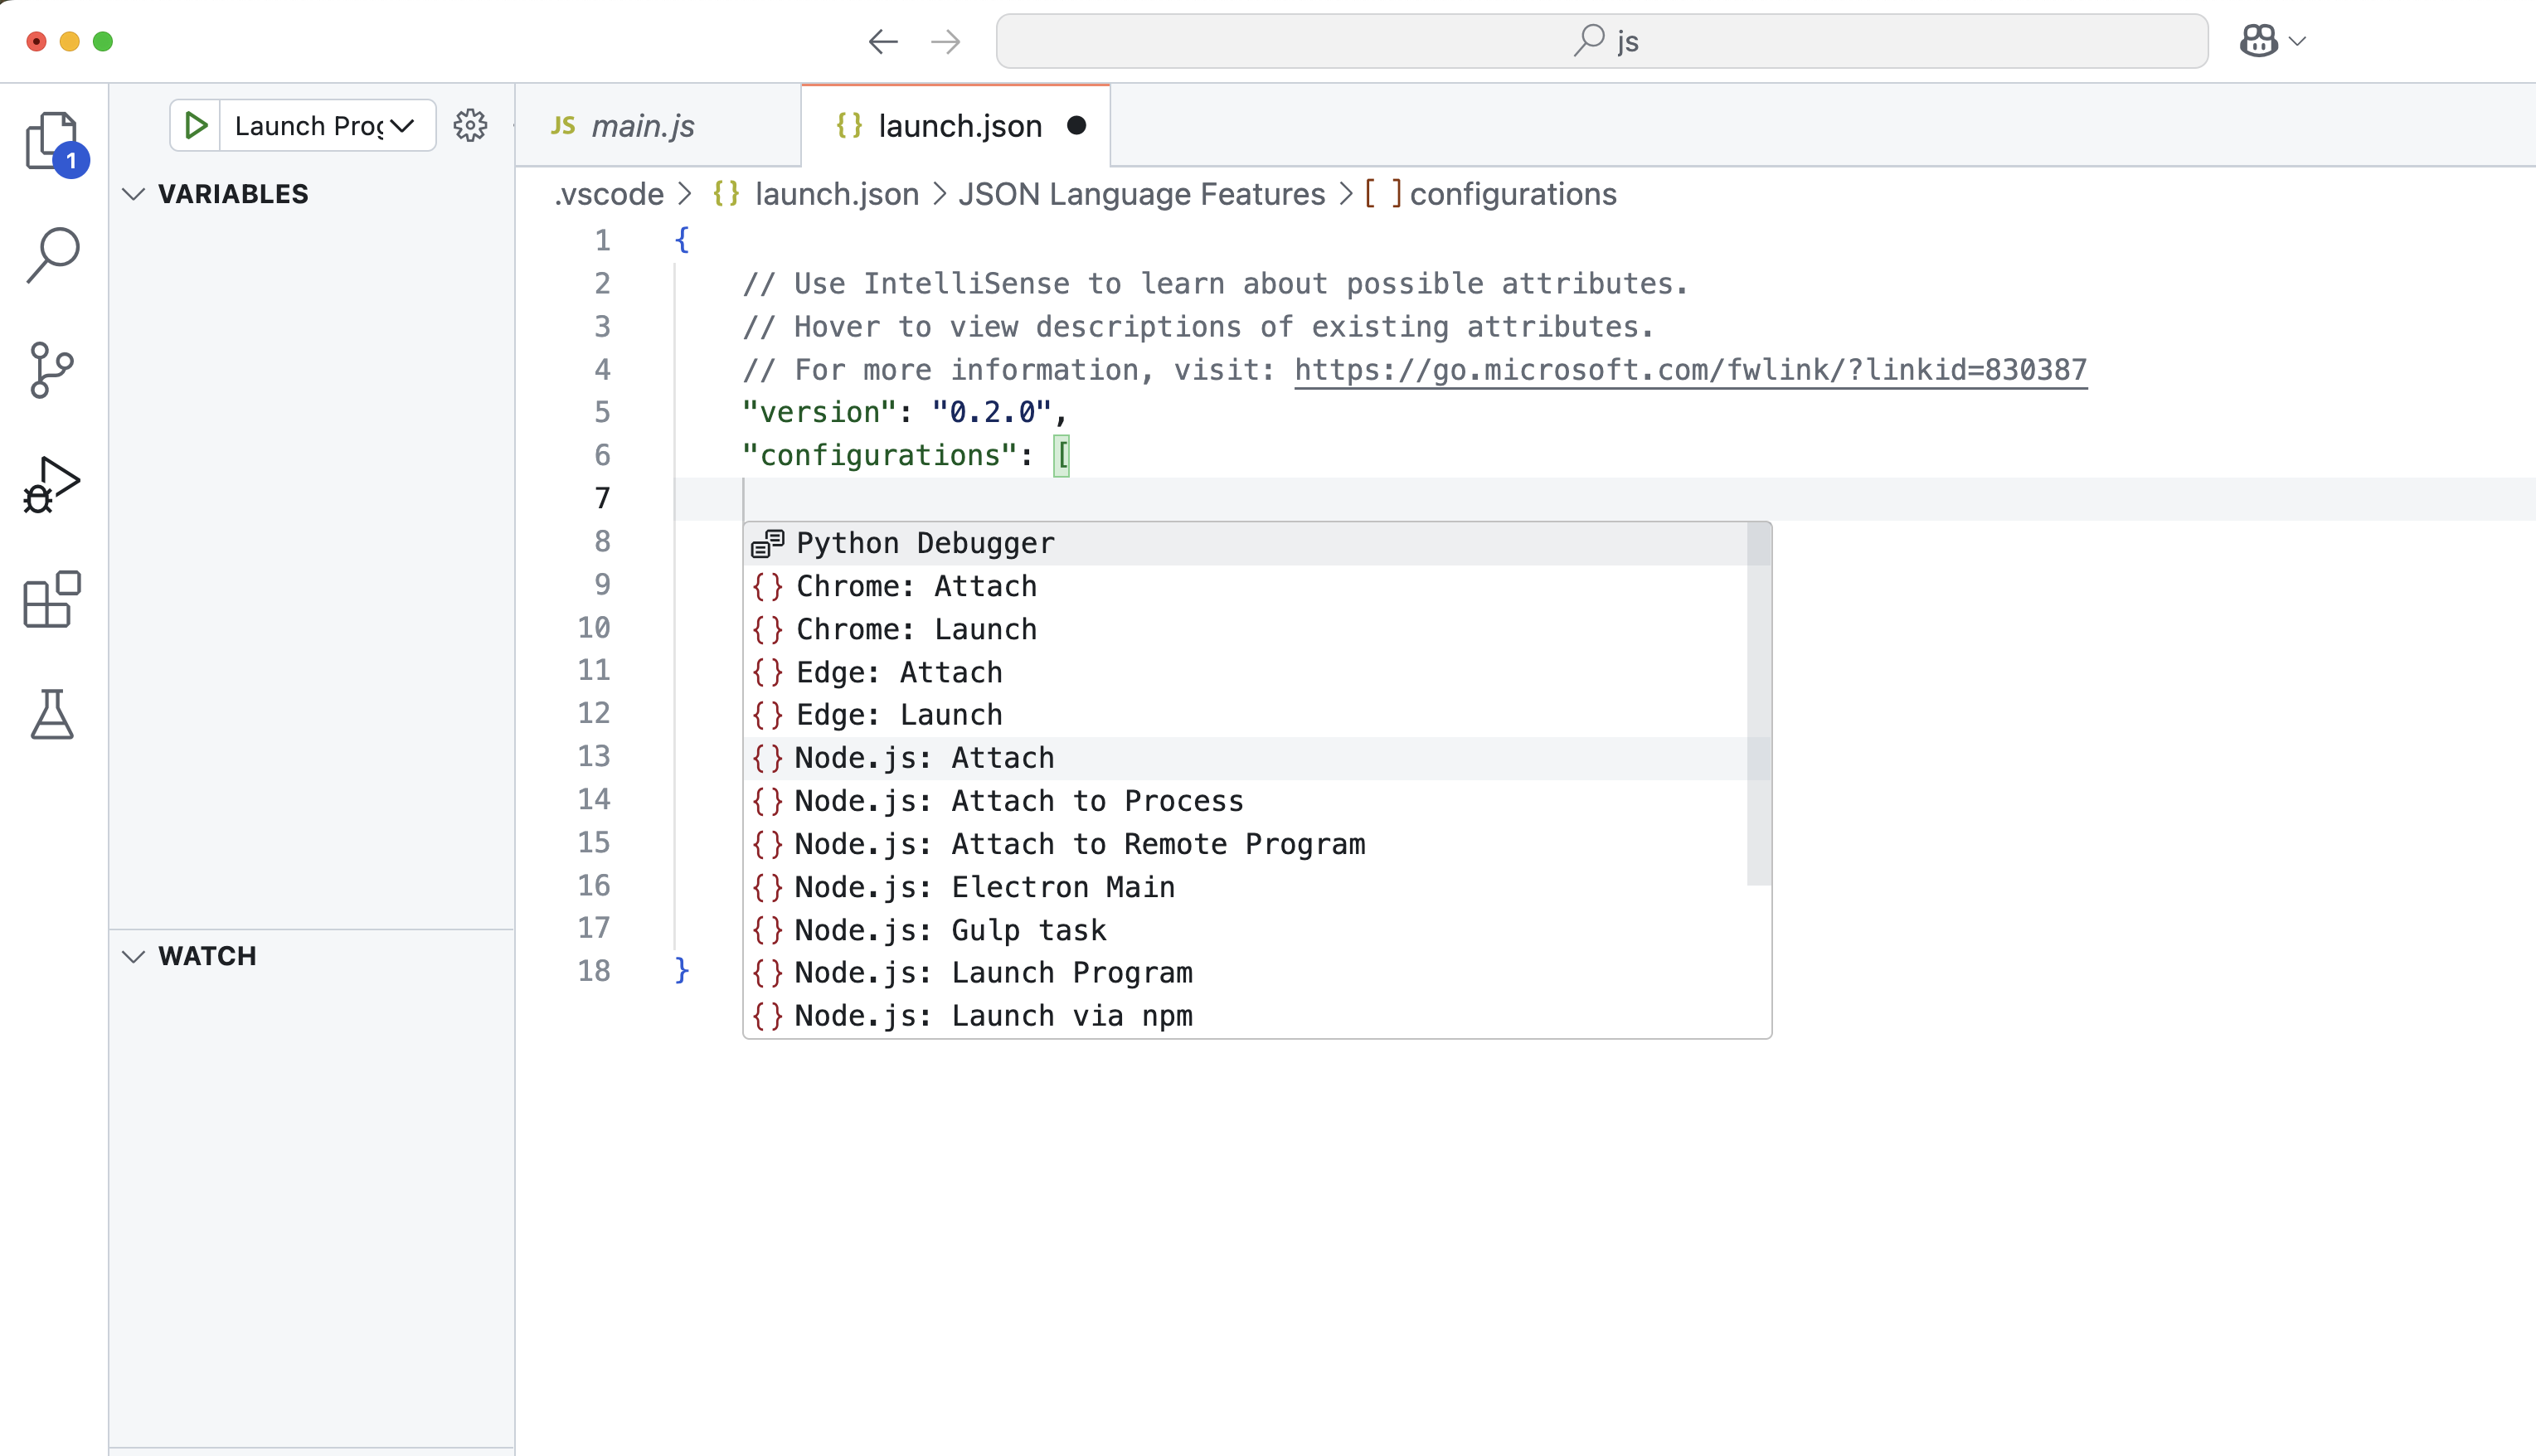
Setting breakpoints
Next, open your main.js file and click to the left of the line number where you want to set a breakpoint.
We add a breakpoint to line 11 in this case. Finally click the green run arrow in the top left that says “Launch Program” (which you’ll recognize is the name from your launch.json file).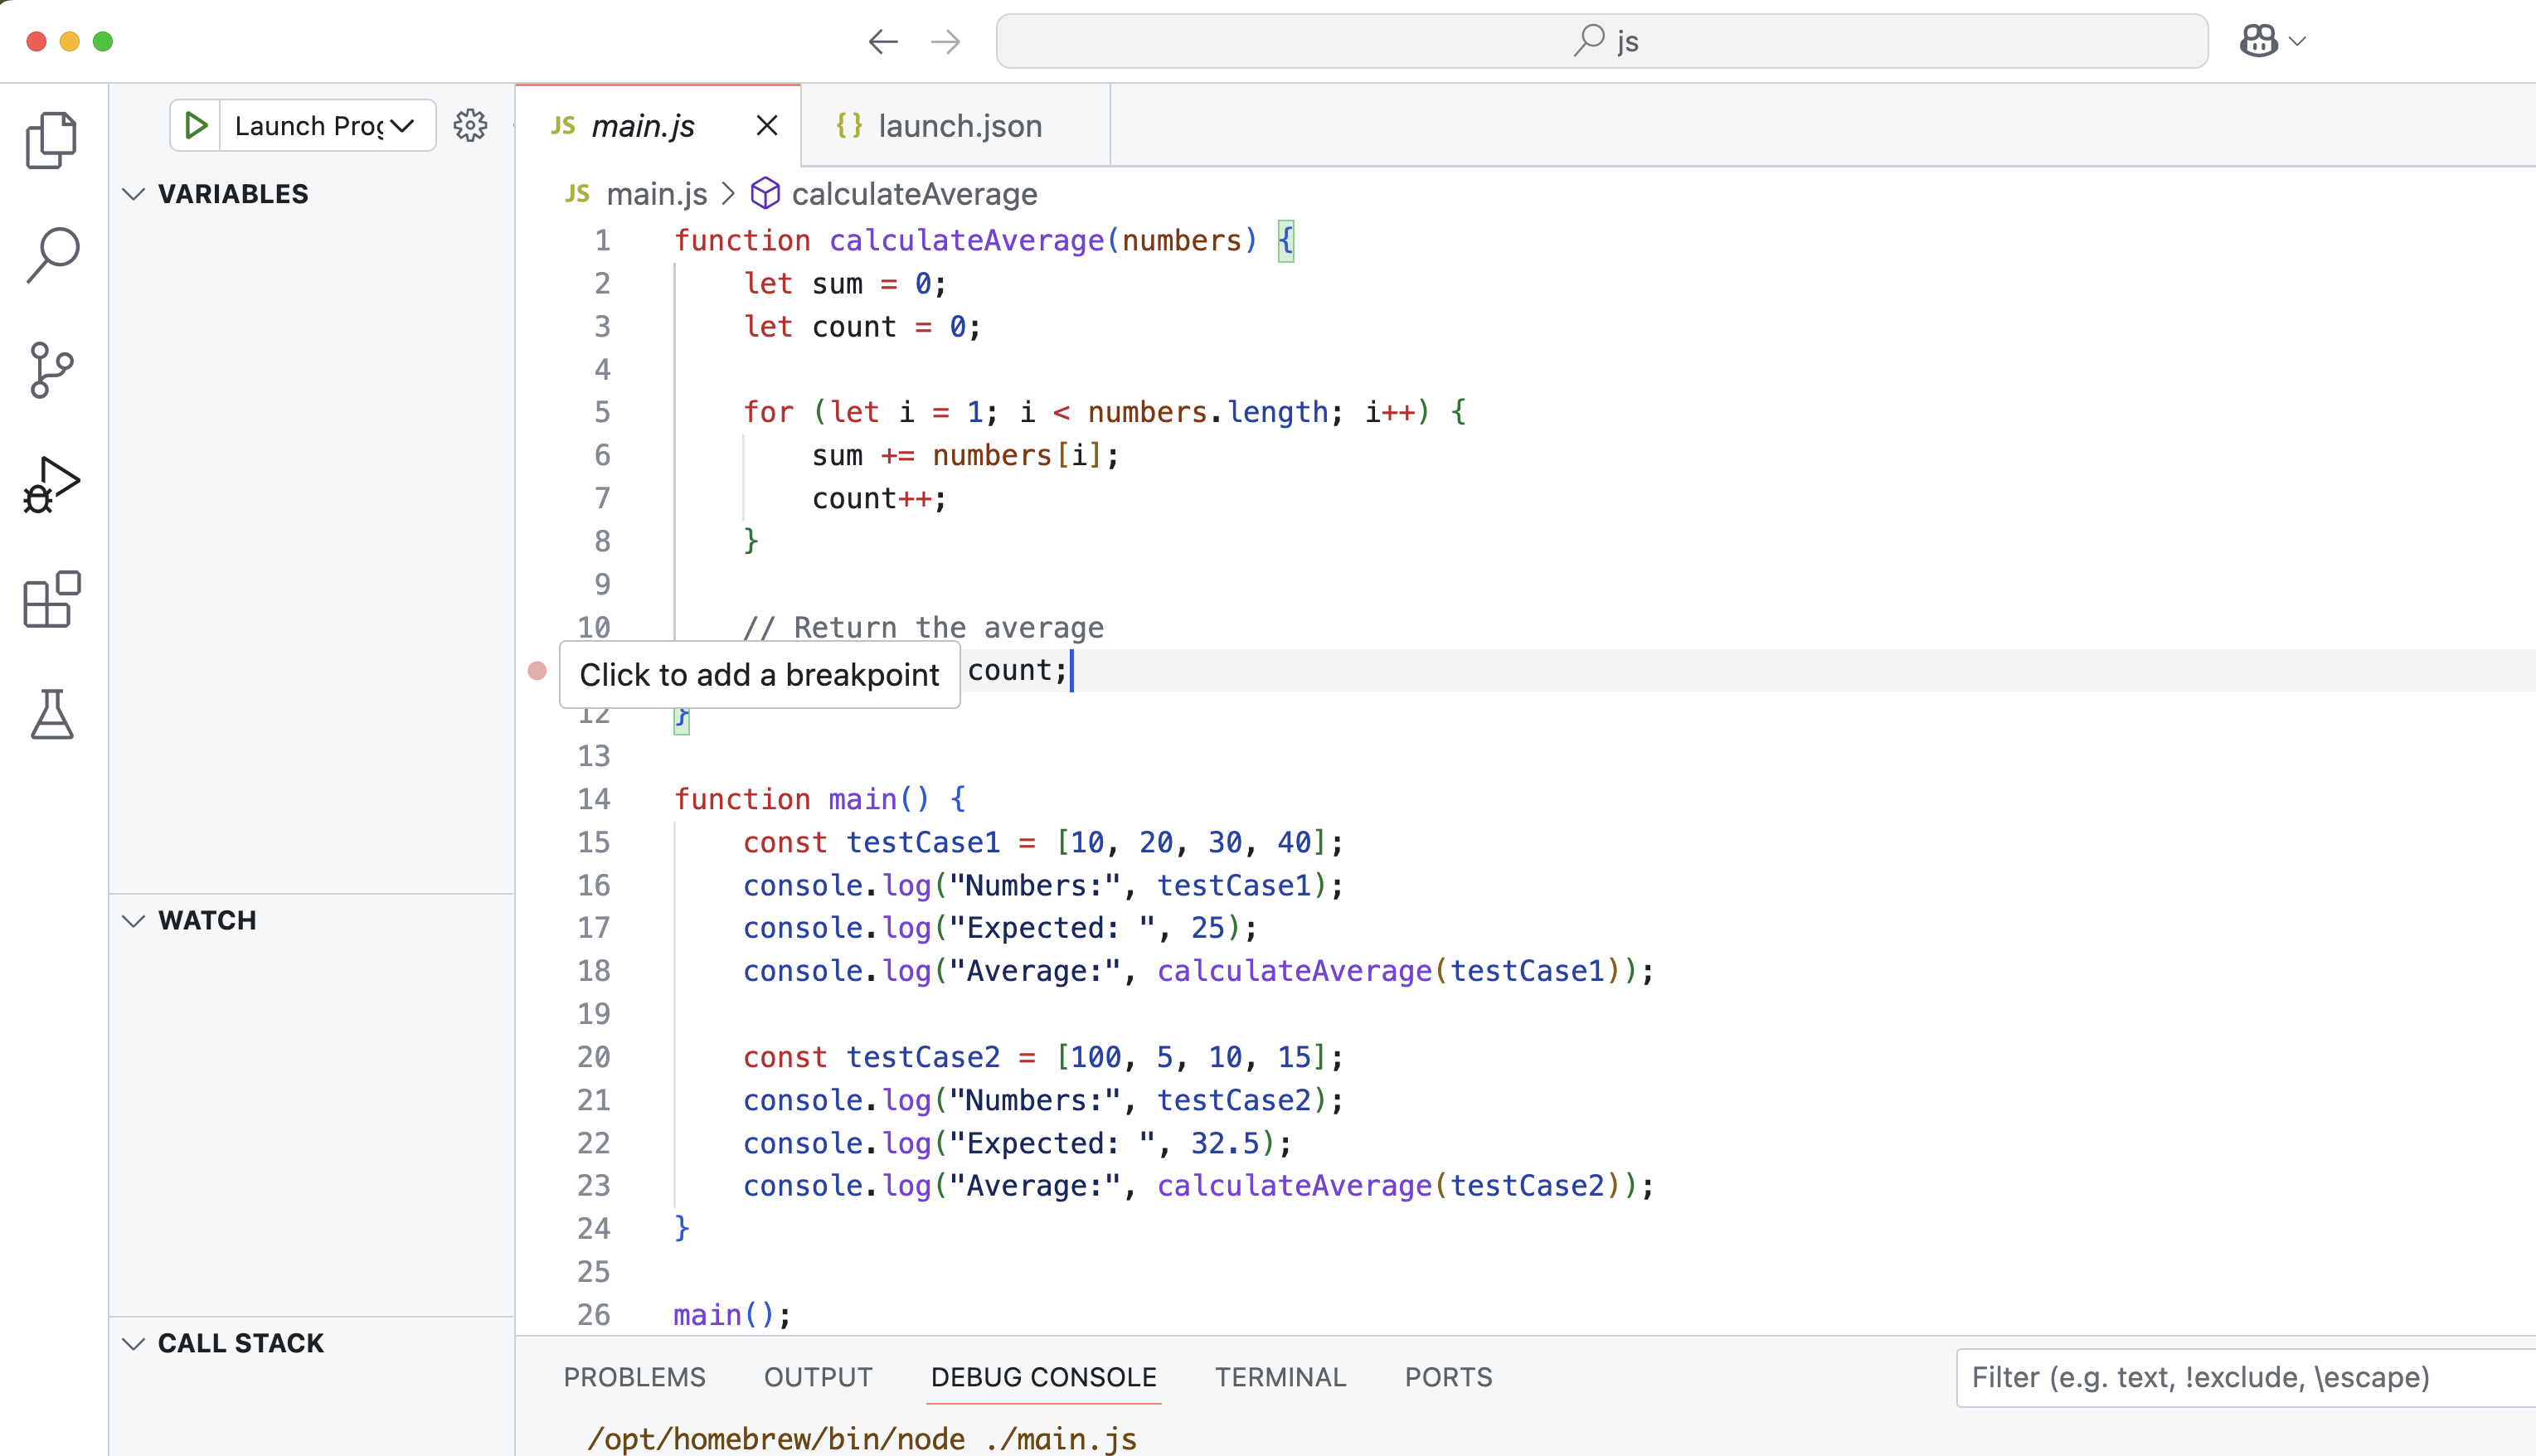
Using the debugger UI
If all is well, the program will execute and pause on line 11.
The UI shows you all of the variables in scope at the current point, the call stack, and more. You might even recognize the control button actions now.
This is where IDEs really shine when it comes to debugging.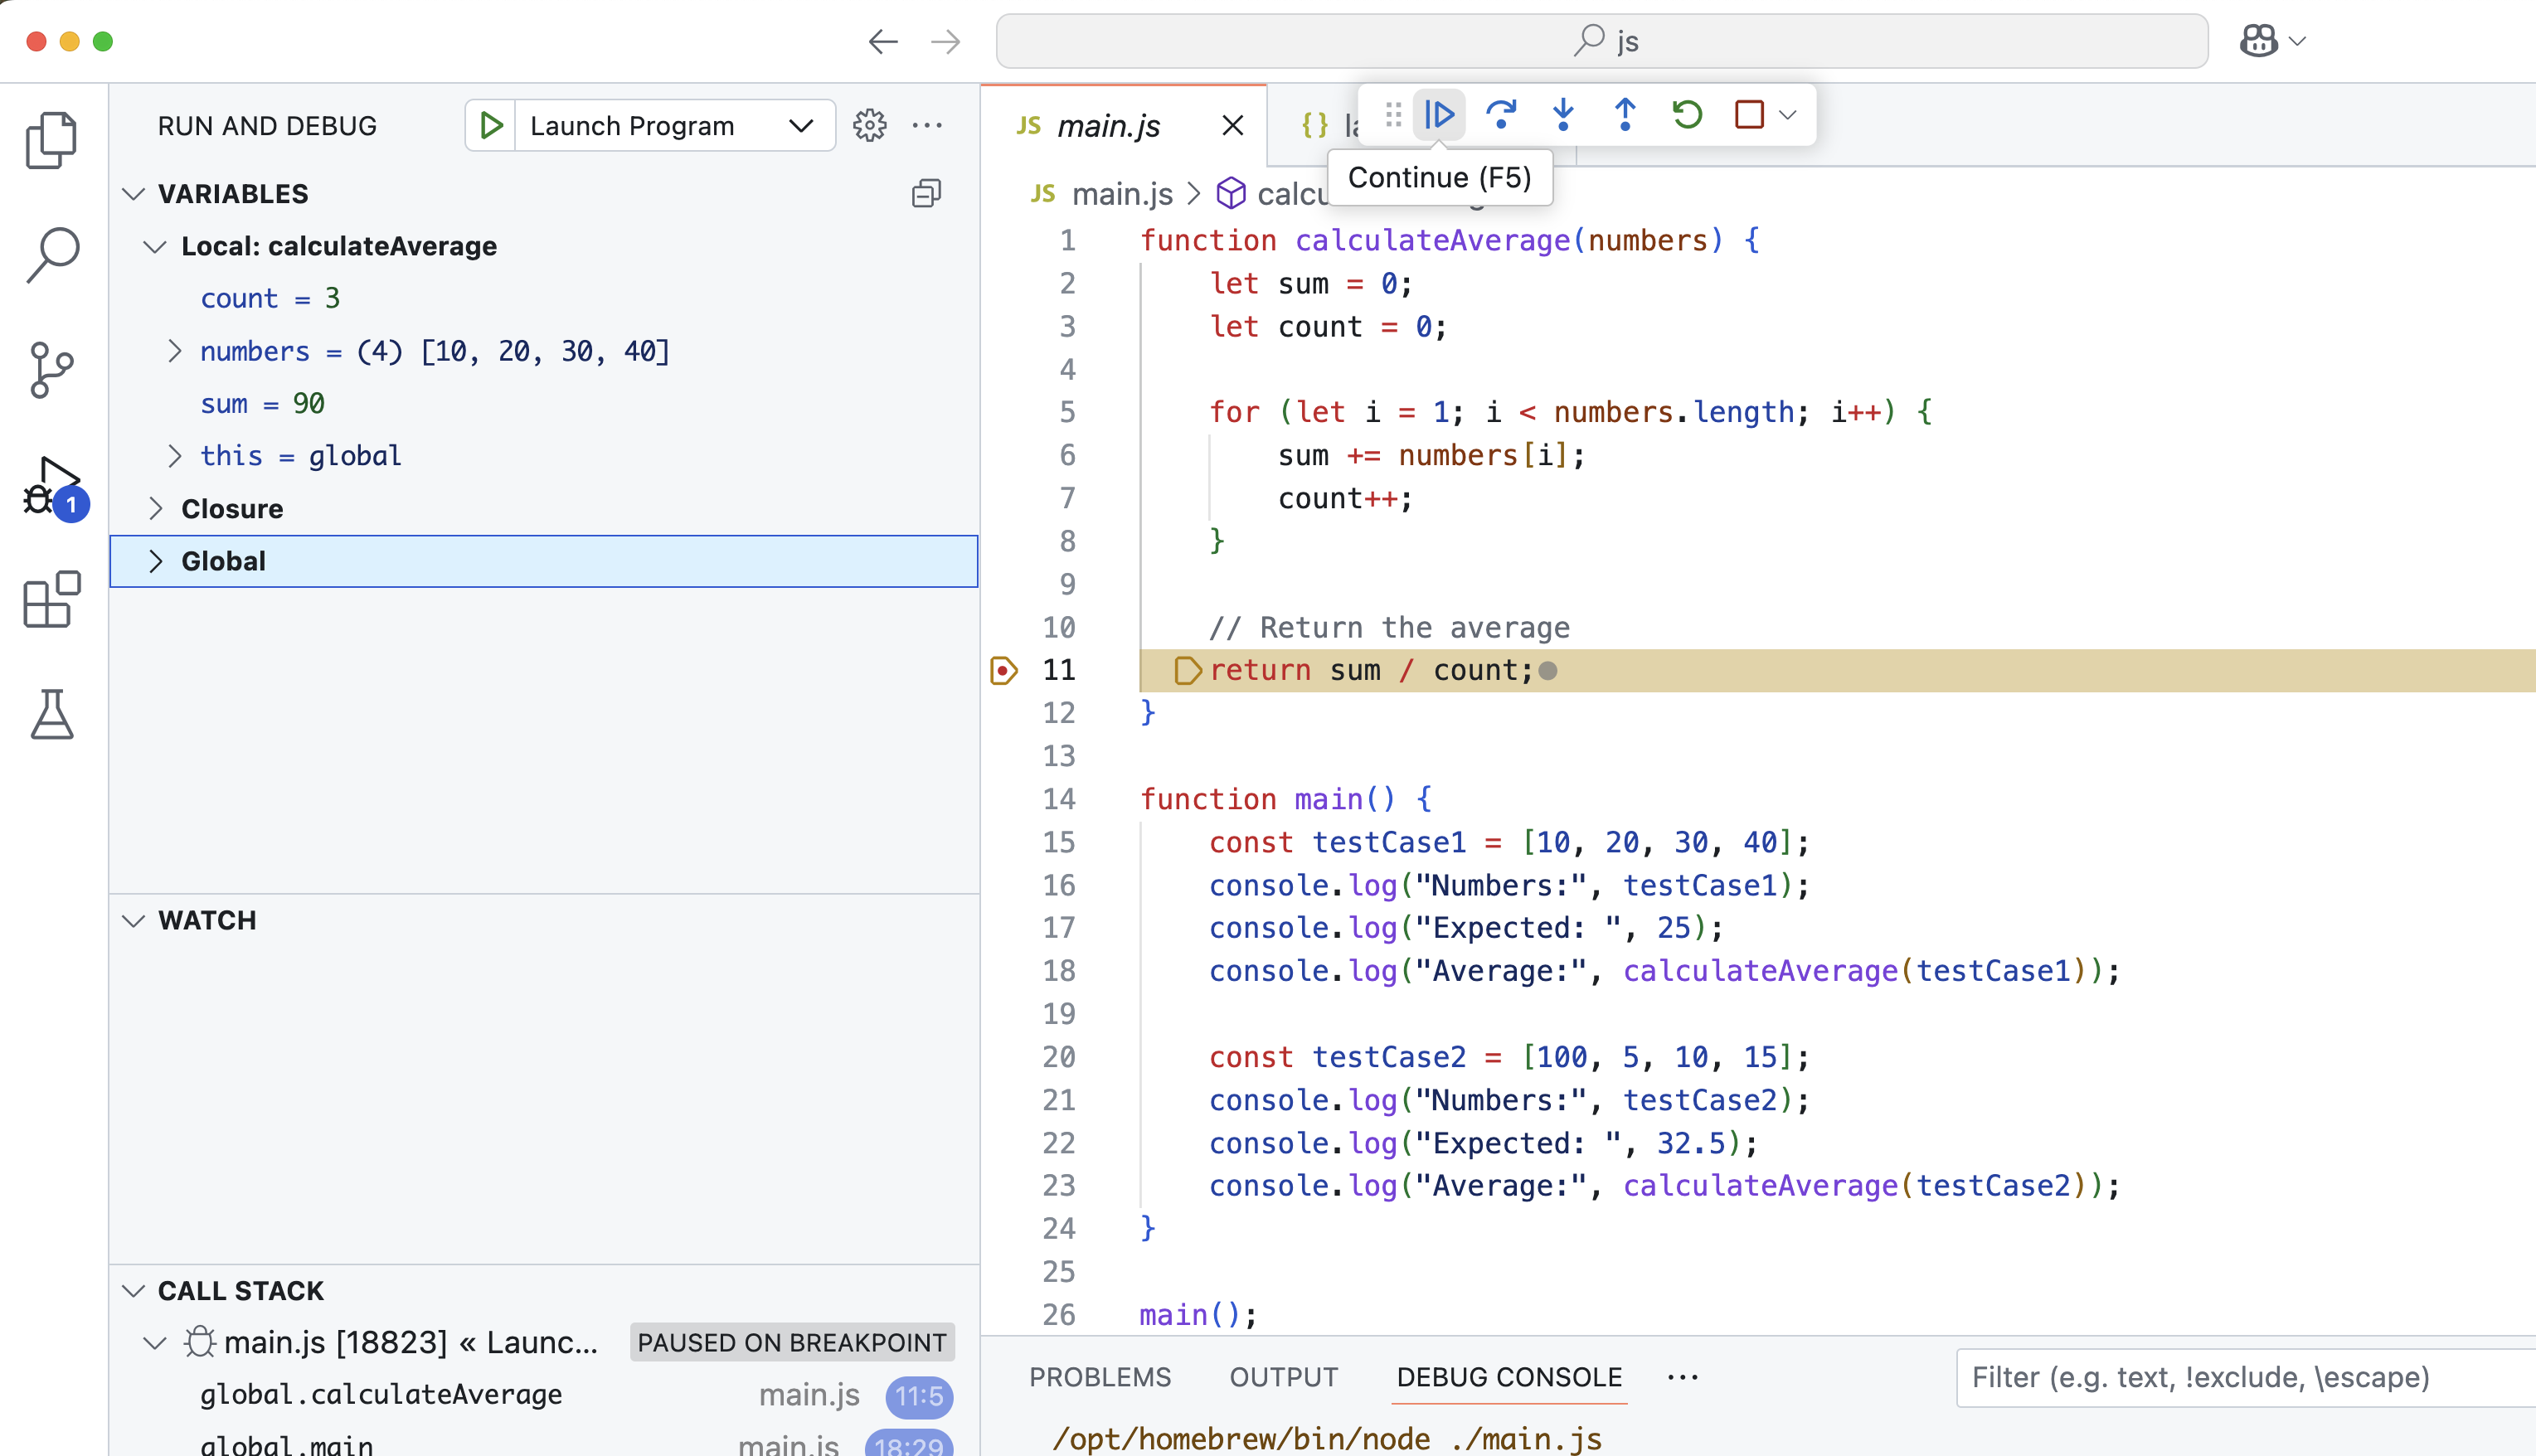
While the setup is a bit cumbersome (launch.json configuration files require that you read documentation to use them properly), the result is a prettier (and arguably more useful) developer experience. VSKids rejoice!
launch.json vs command line arguments
Remember, your editor is just using the language’s debugger. Many editors use DAP (universal debugger api) configured with a launch.json file. Here’s a table of debug node commands and their equivalent launch.json settings.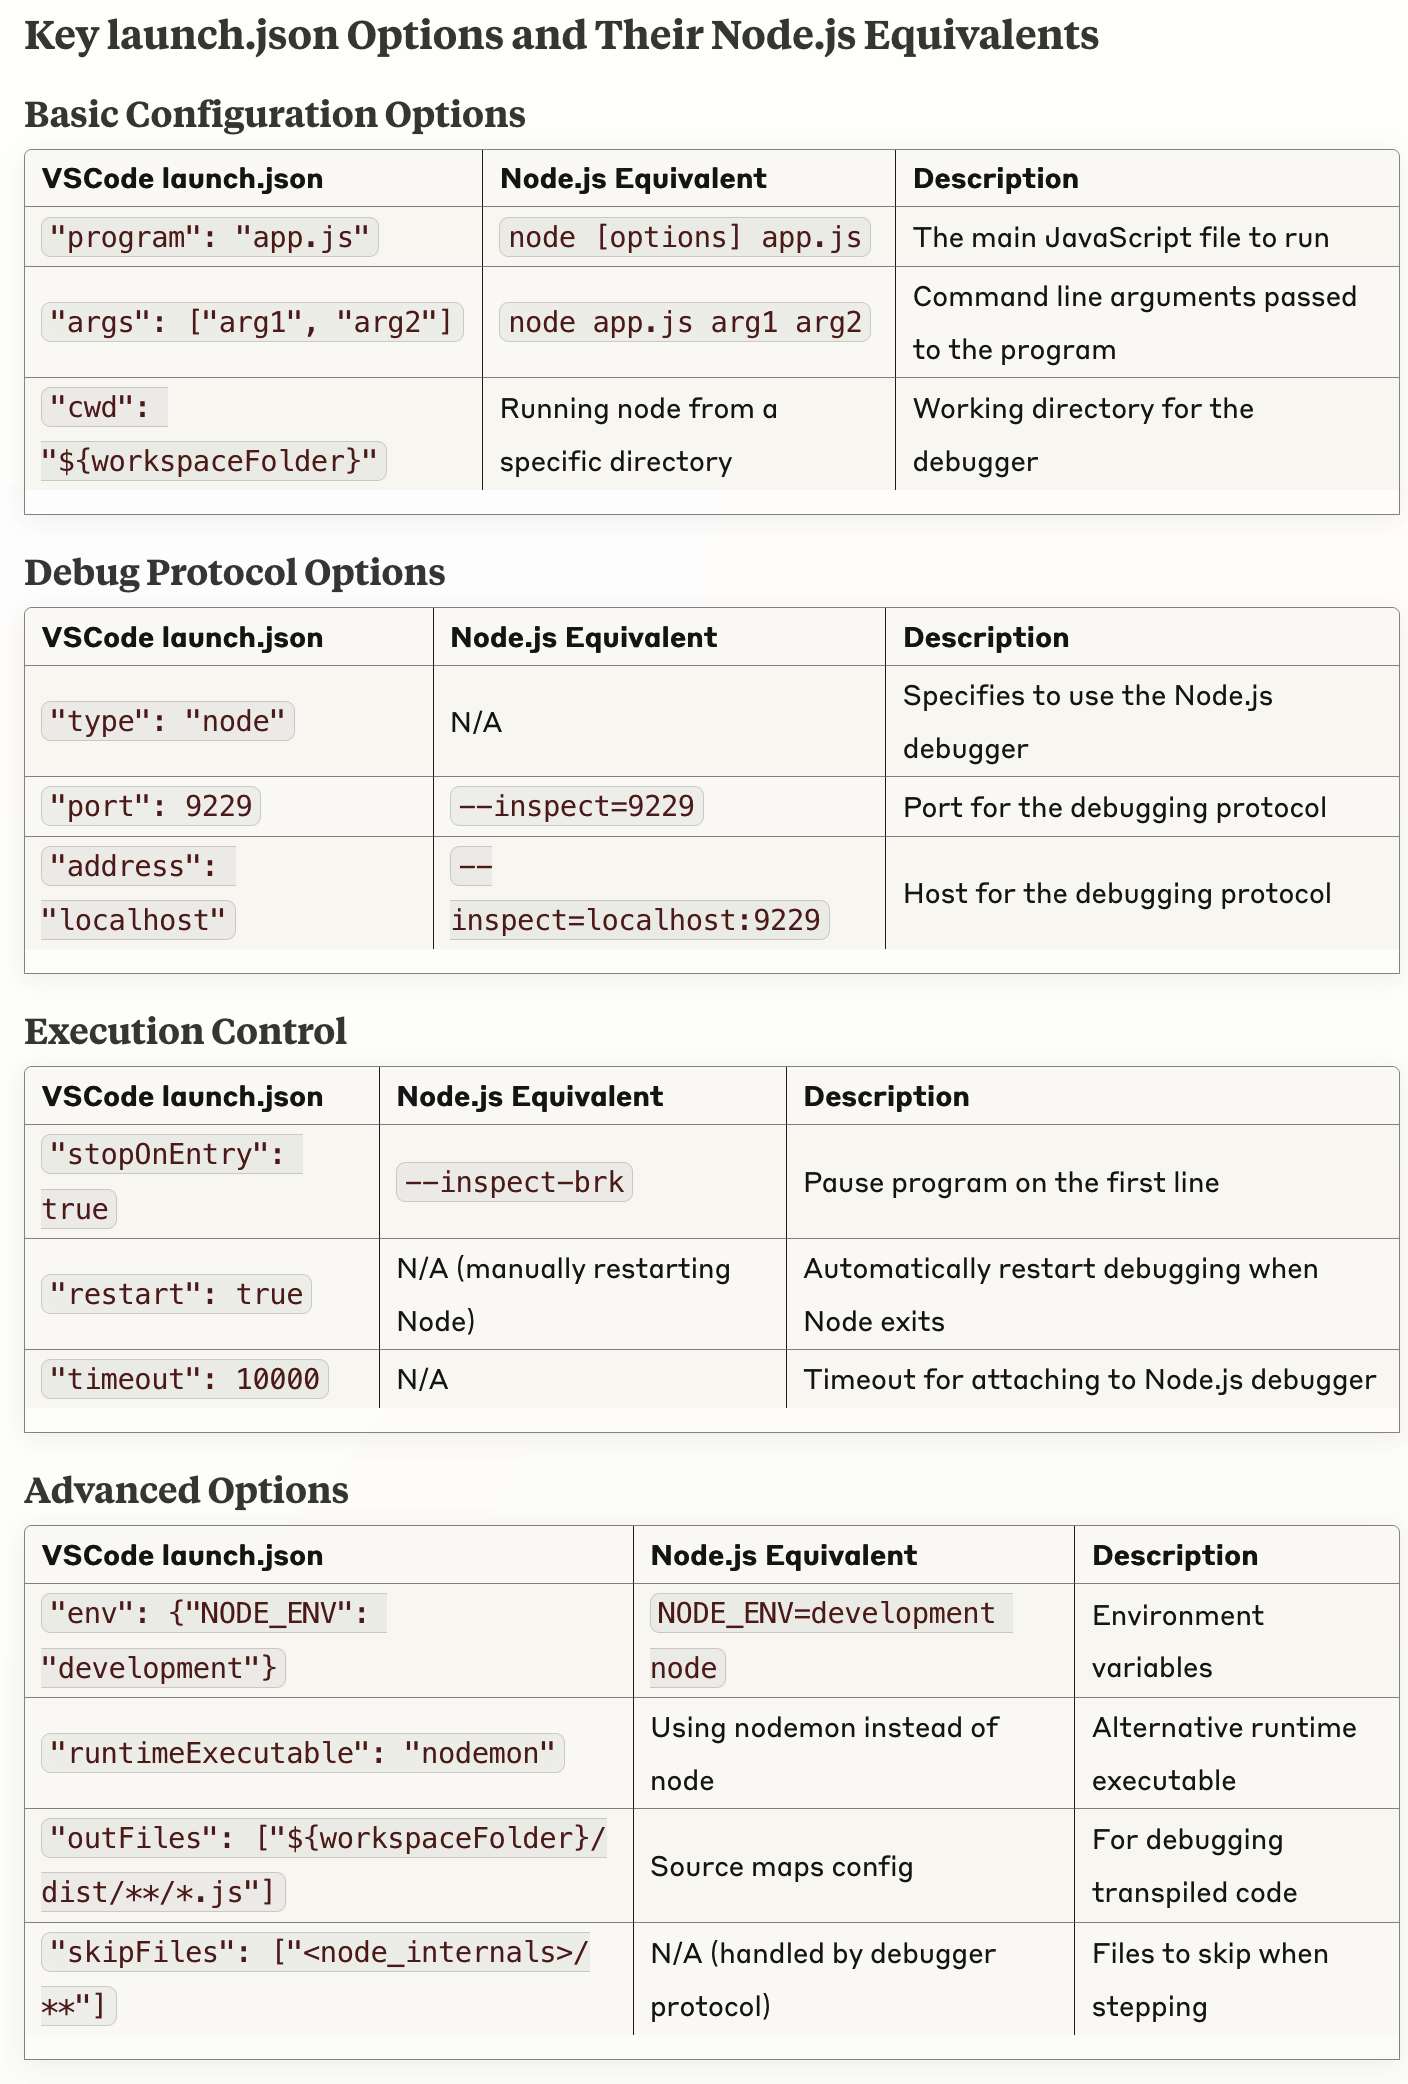
There are plenty more, but you get the idea that most parts of a launch.json correspond to some CLI equivalent.
Debugging in neovim
Fear not ye neovim zealots.
You can have similar functionality in your neovim environment. To save me some keystrokes, I recommend you check out the following video by typecraft. He does a stellar explanation and demo of setting up and using a UI-forward debugging experience in neovim. I won’t re-create everything here.
Typecraft - Configuring Debugger in Neovim
Basic Instructions
- Genuinely, follow that typecraft video!
- Install
nvim-dapandnvim-dap-ui - Configure some basic key bindings for common debug commands (e.g.
continueandset breakpoint) - Configure some listeners to open and close helpful UI screens
- Setup and install additional packages as required by your language of choice
- Debug with a UI in
neovim
Debugging in emacs
Emacs is my favorite editor. It is more configurable than neovim and more capable than every IDE on the market. It is also a massive PITA sometimes. Getting my debuggers working in emacs on Apple Silicon was a real hassle. Luckily, I suffered so you don’t have to!
Bottom line: At least on a mac, I needed to use the DAPE package instead of the DAP package.
I will be using doom emacs for this because that’s just how I’m rolling these days. But you can adapt this for any flavor of emacs.
Installing DAPE
Comment out anything in your
init.elfile to do with debugging (if on Doom)Add this line to your
packages.elfile to install dape:(package! dape) ;; debugging in emacsAdd these lines to your
config.elfile to configure a basic debugging setup;;;; DAPE Debugger Configuration (use-package! dape :config ;; Optional: Global keybindings (map! :leader :desc "Debug start/continue" "d d" #'dape :desc "Debug stop" "d k" #'dape-stop :desc "Debug restart" "d r" #'dape-restart :desc "Debug next" "d n" #'dape-next :desc "Debug step in" "d i" #'dape-step-in :desc "Debug step out" "d o" #'dape-step-out :desc "Debug continue" "d c" #'dape-continue :desc "Toggle Breakpoint" "d b" #'dape-breakpoint-toggle))Following the directions, and install any relevant debugger software you need on your system.
Using DAPE
After configuring dape and installing you can simply open your target file and use space d to see your keybindings.
I’ll set a breakpoint on line 7 space d b 7 and run the debugger with space d d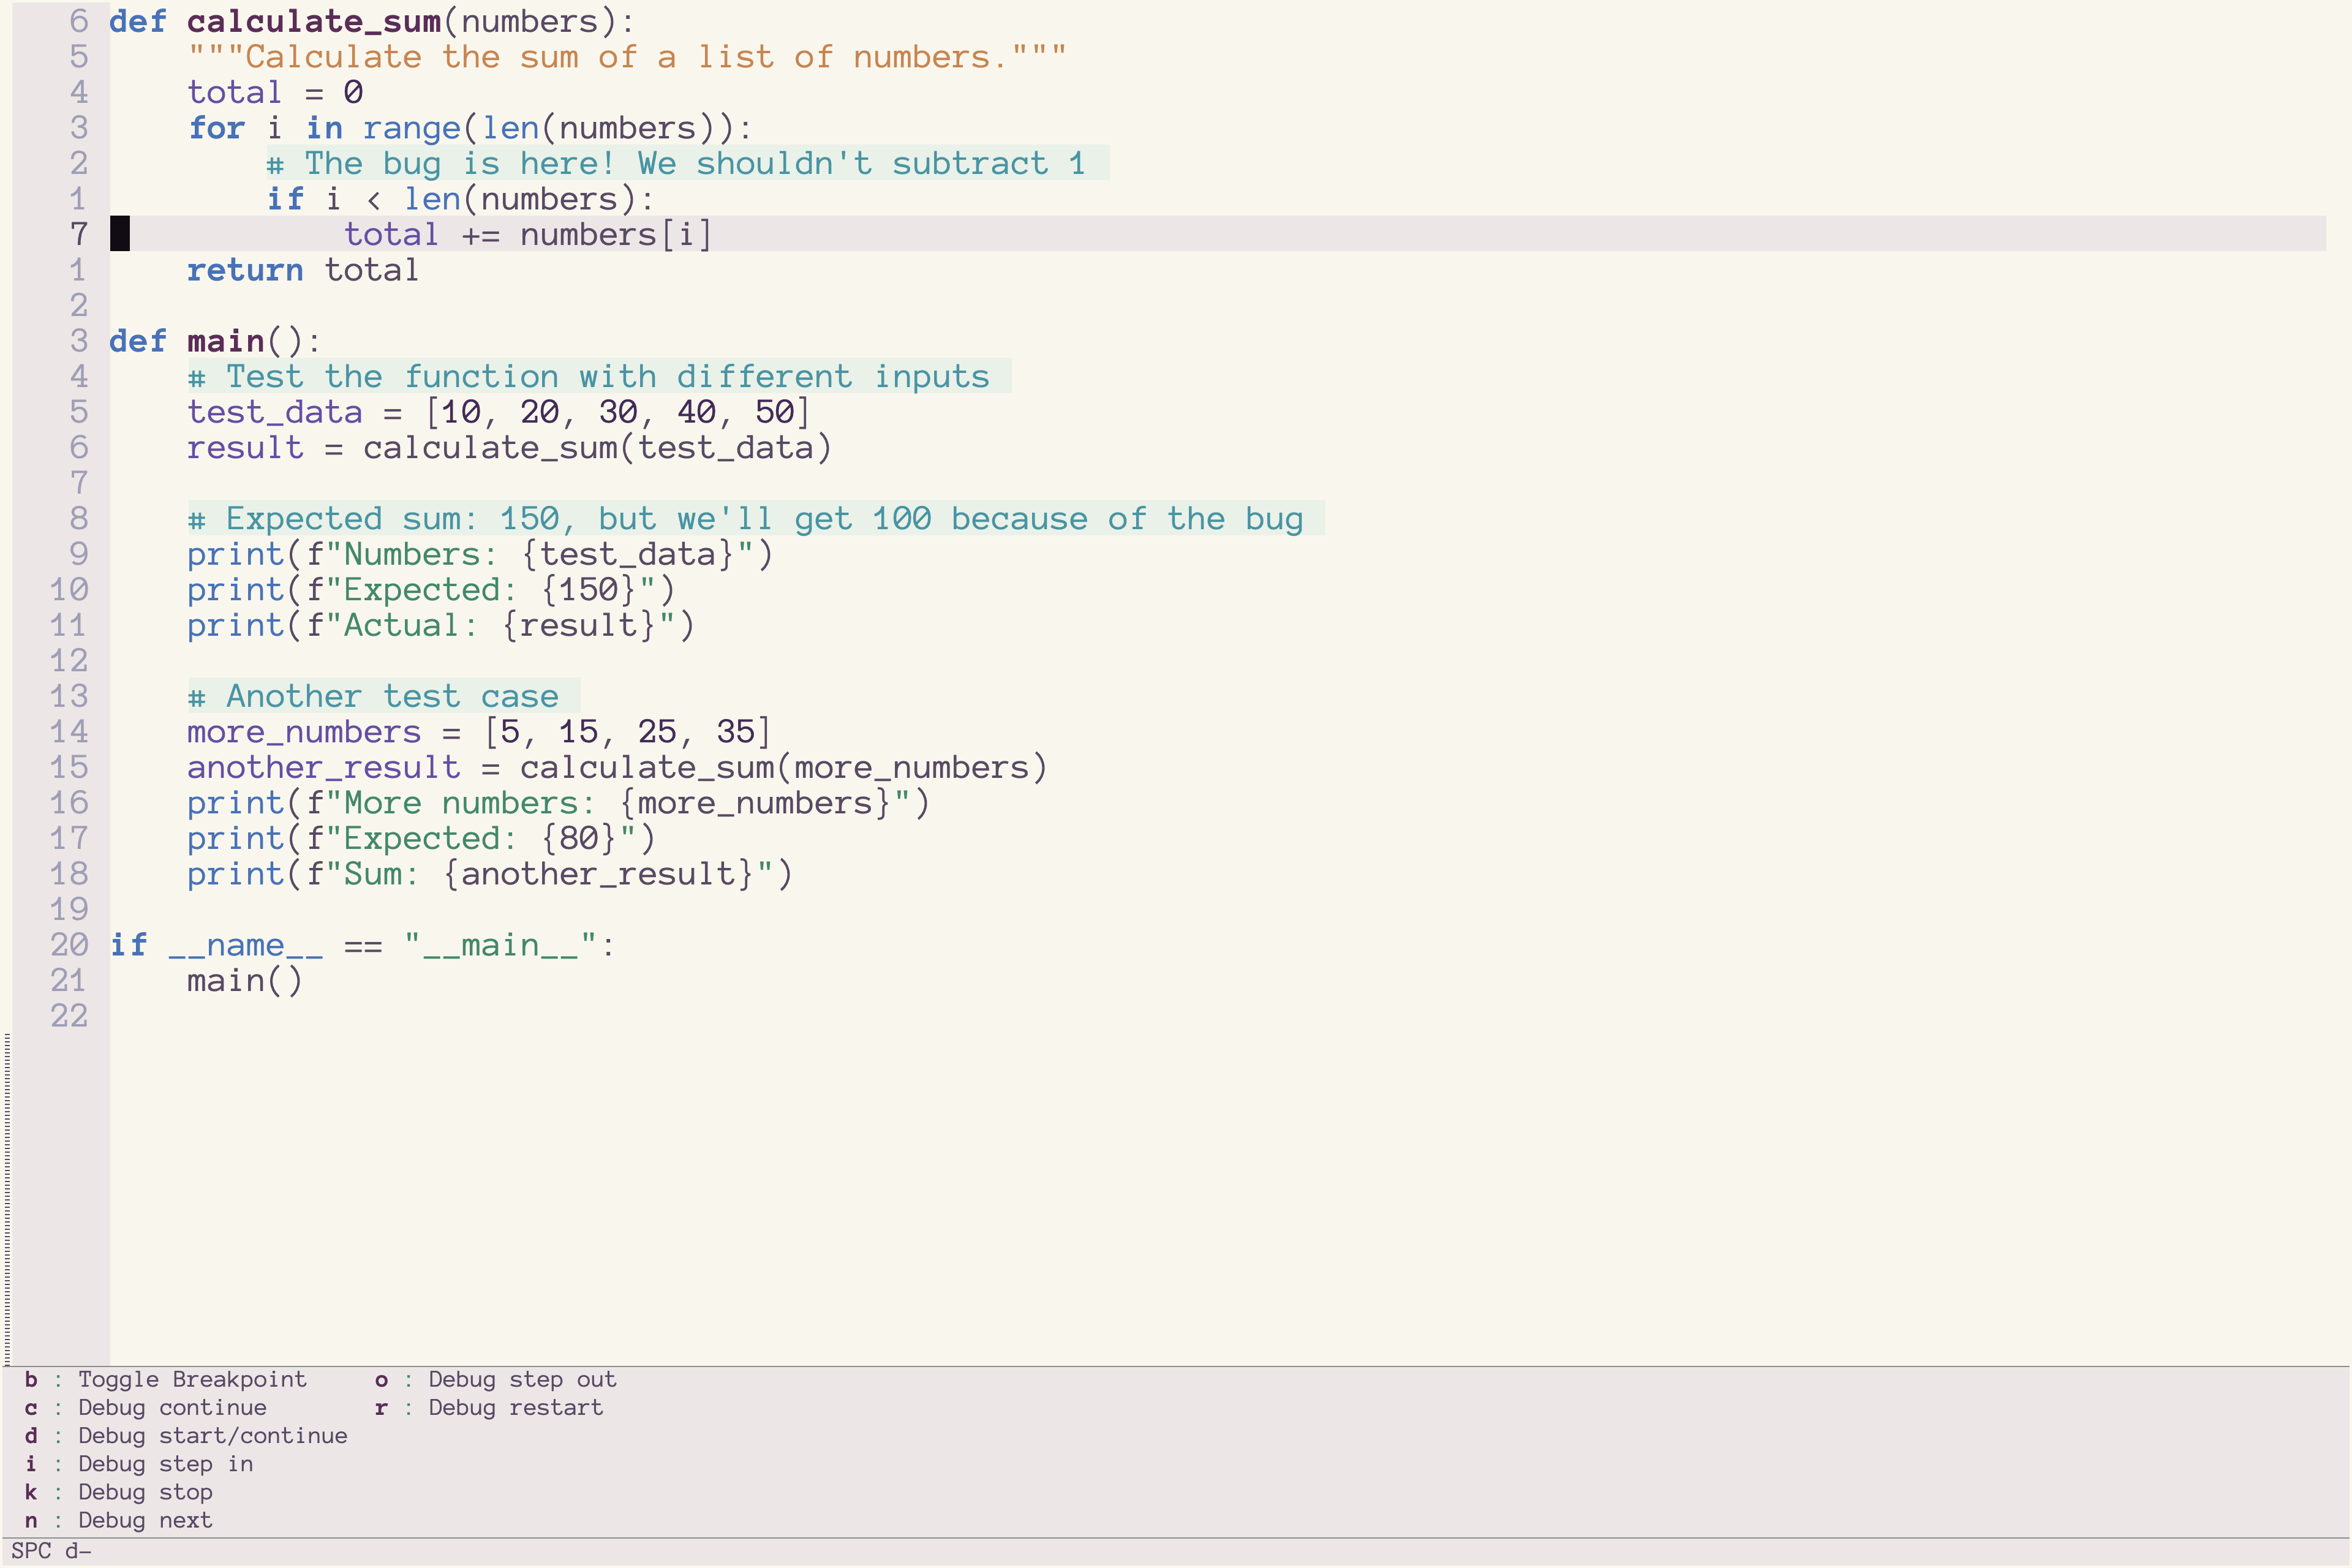
This will show the following transient buffer which lets you set different options for the debug adapter you’ve chosen.
In my case, I chose to use debugpy. If I just want to run the program, I can just hit enter. Alternatively, I could do debugpy :stopOnEntry t to have the program pause immediately when starting, similarly to how debuggers behave in the terminal.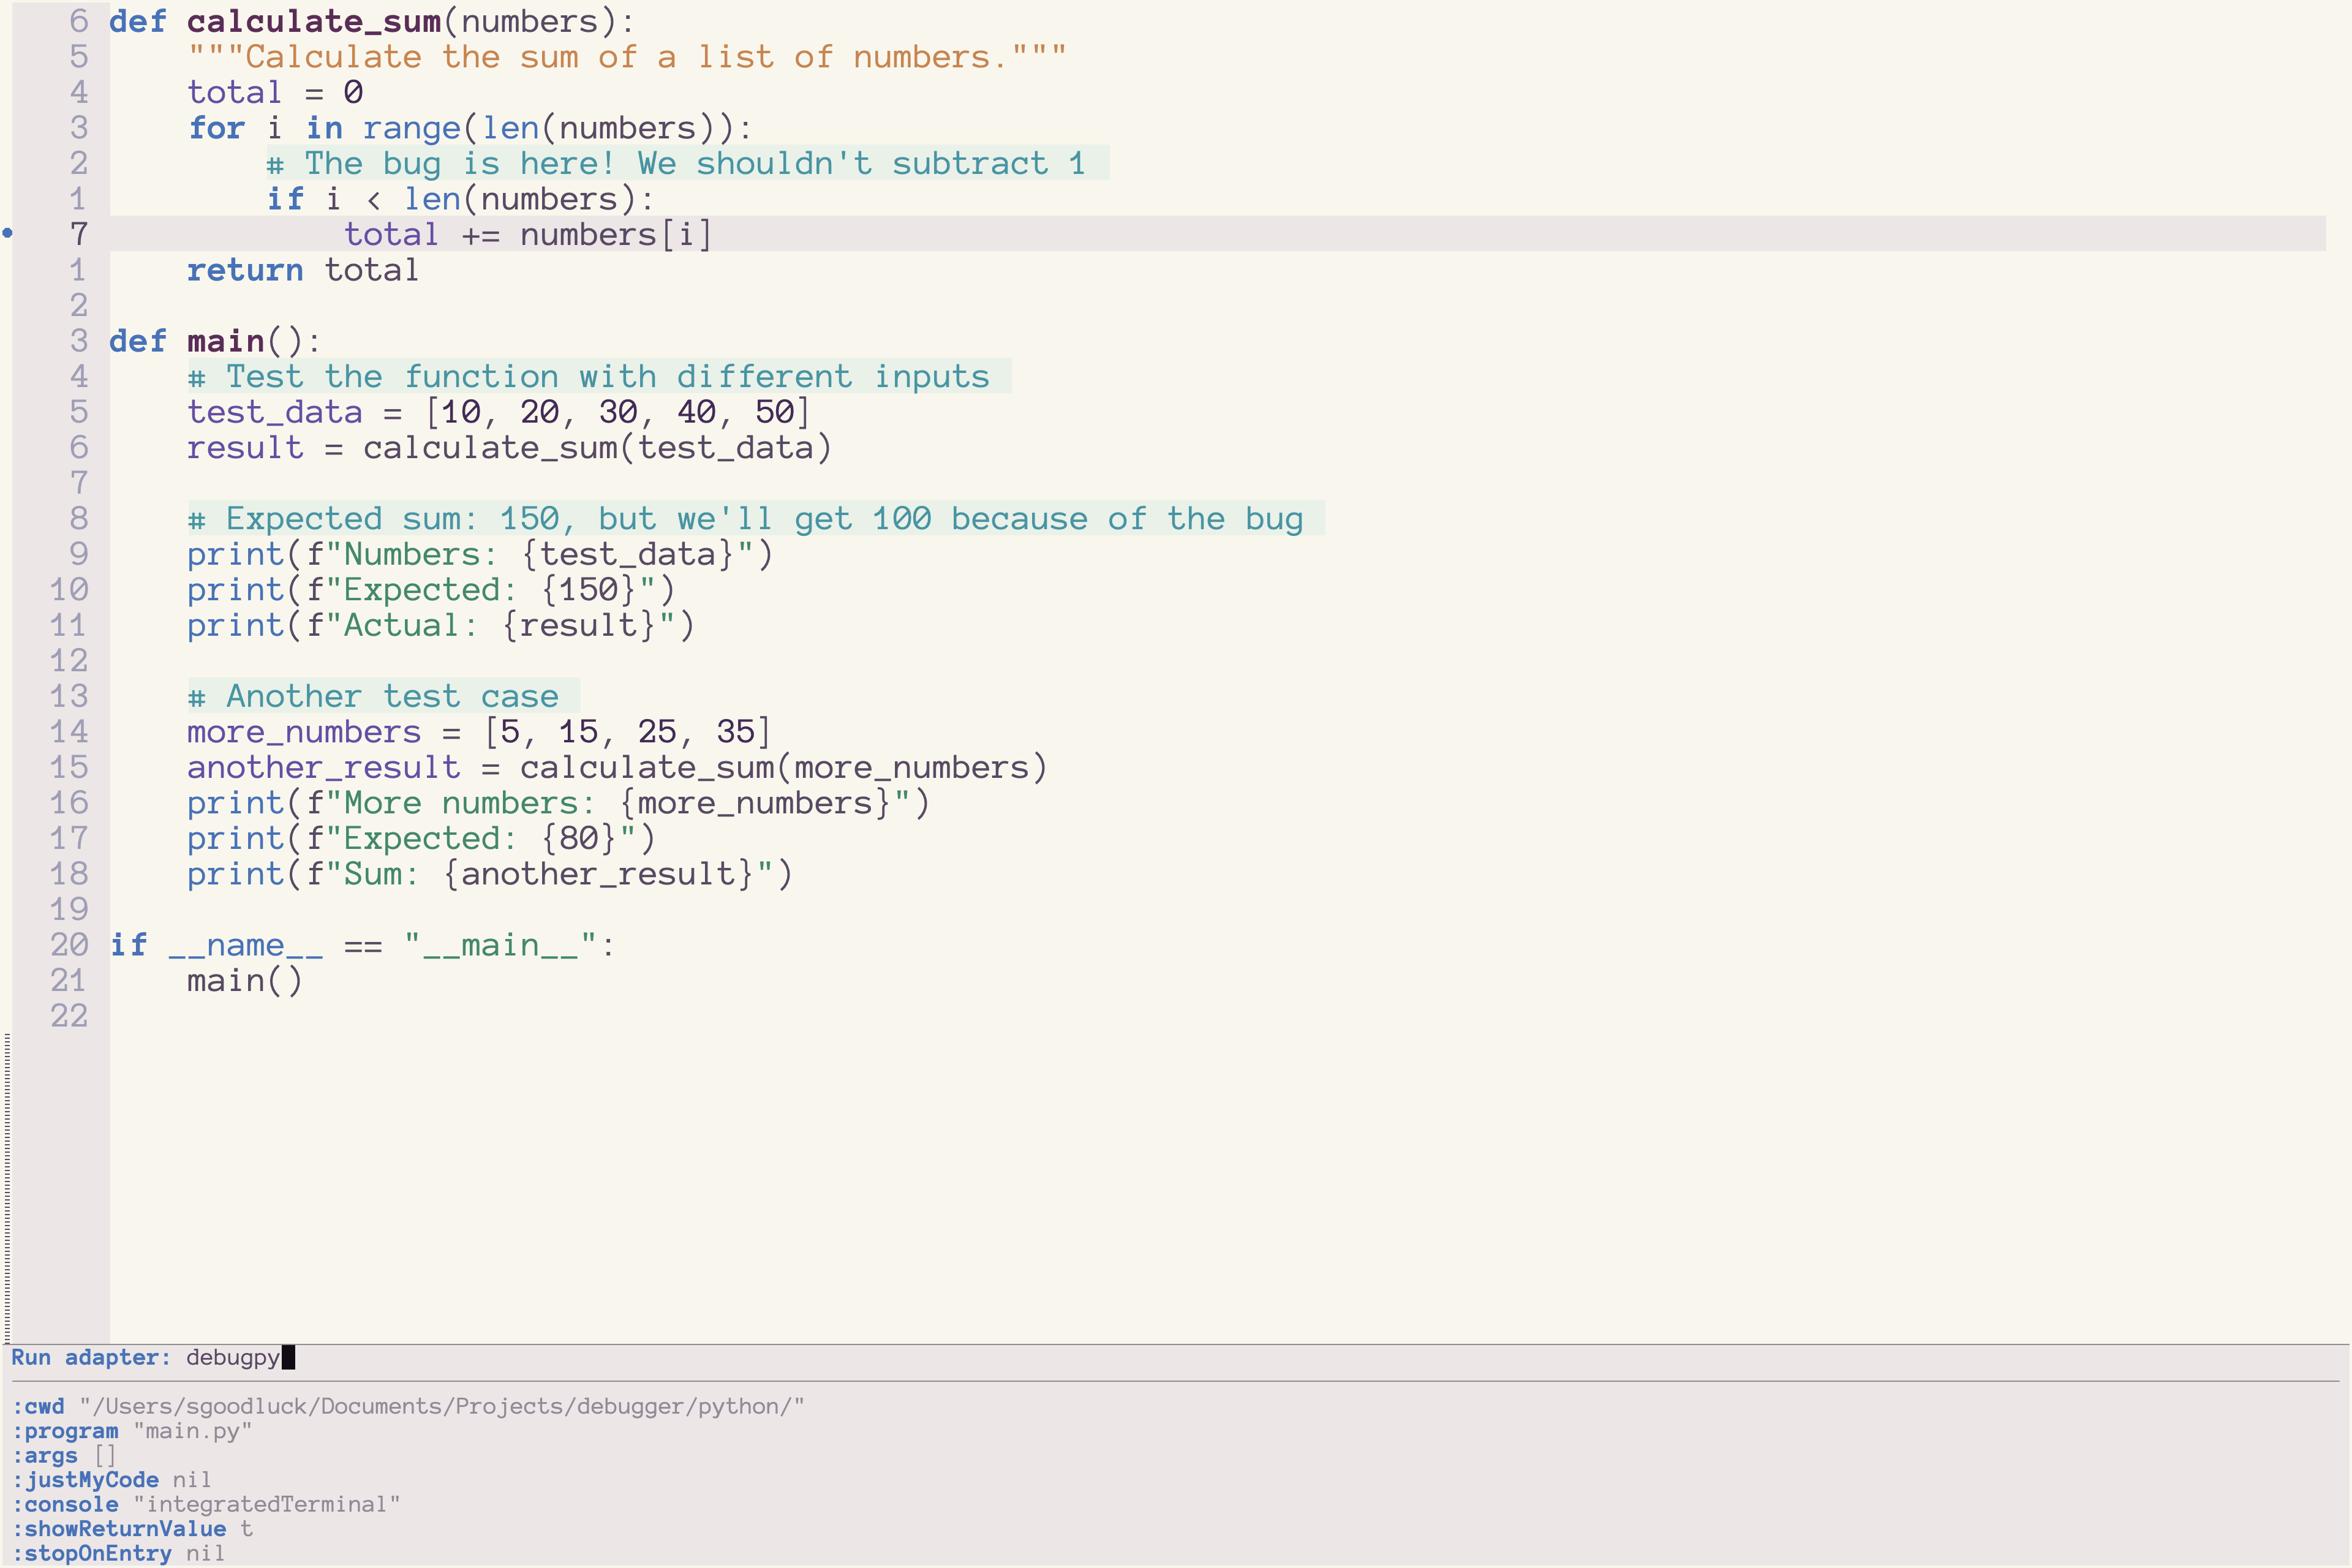
Once you run the program, we get familiar looking UI that allows us to debug our program.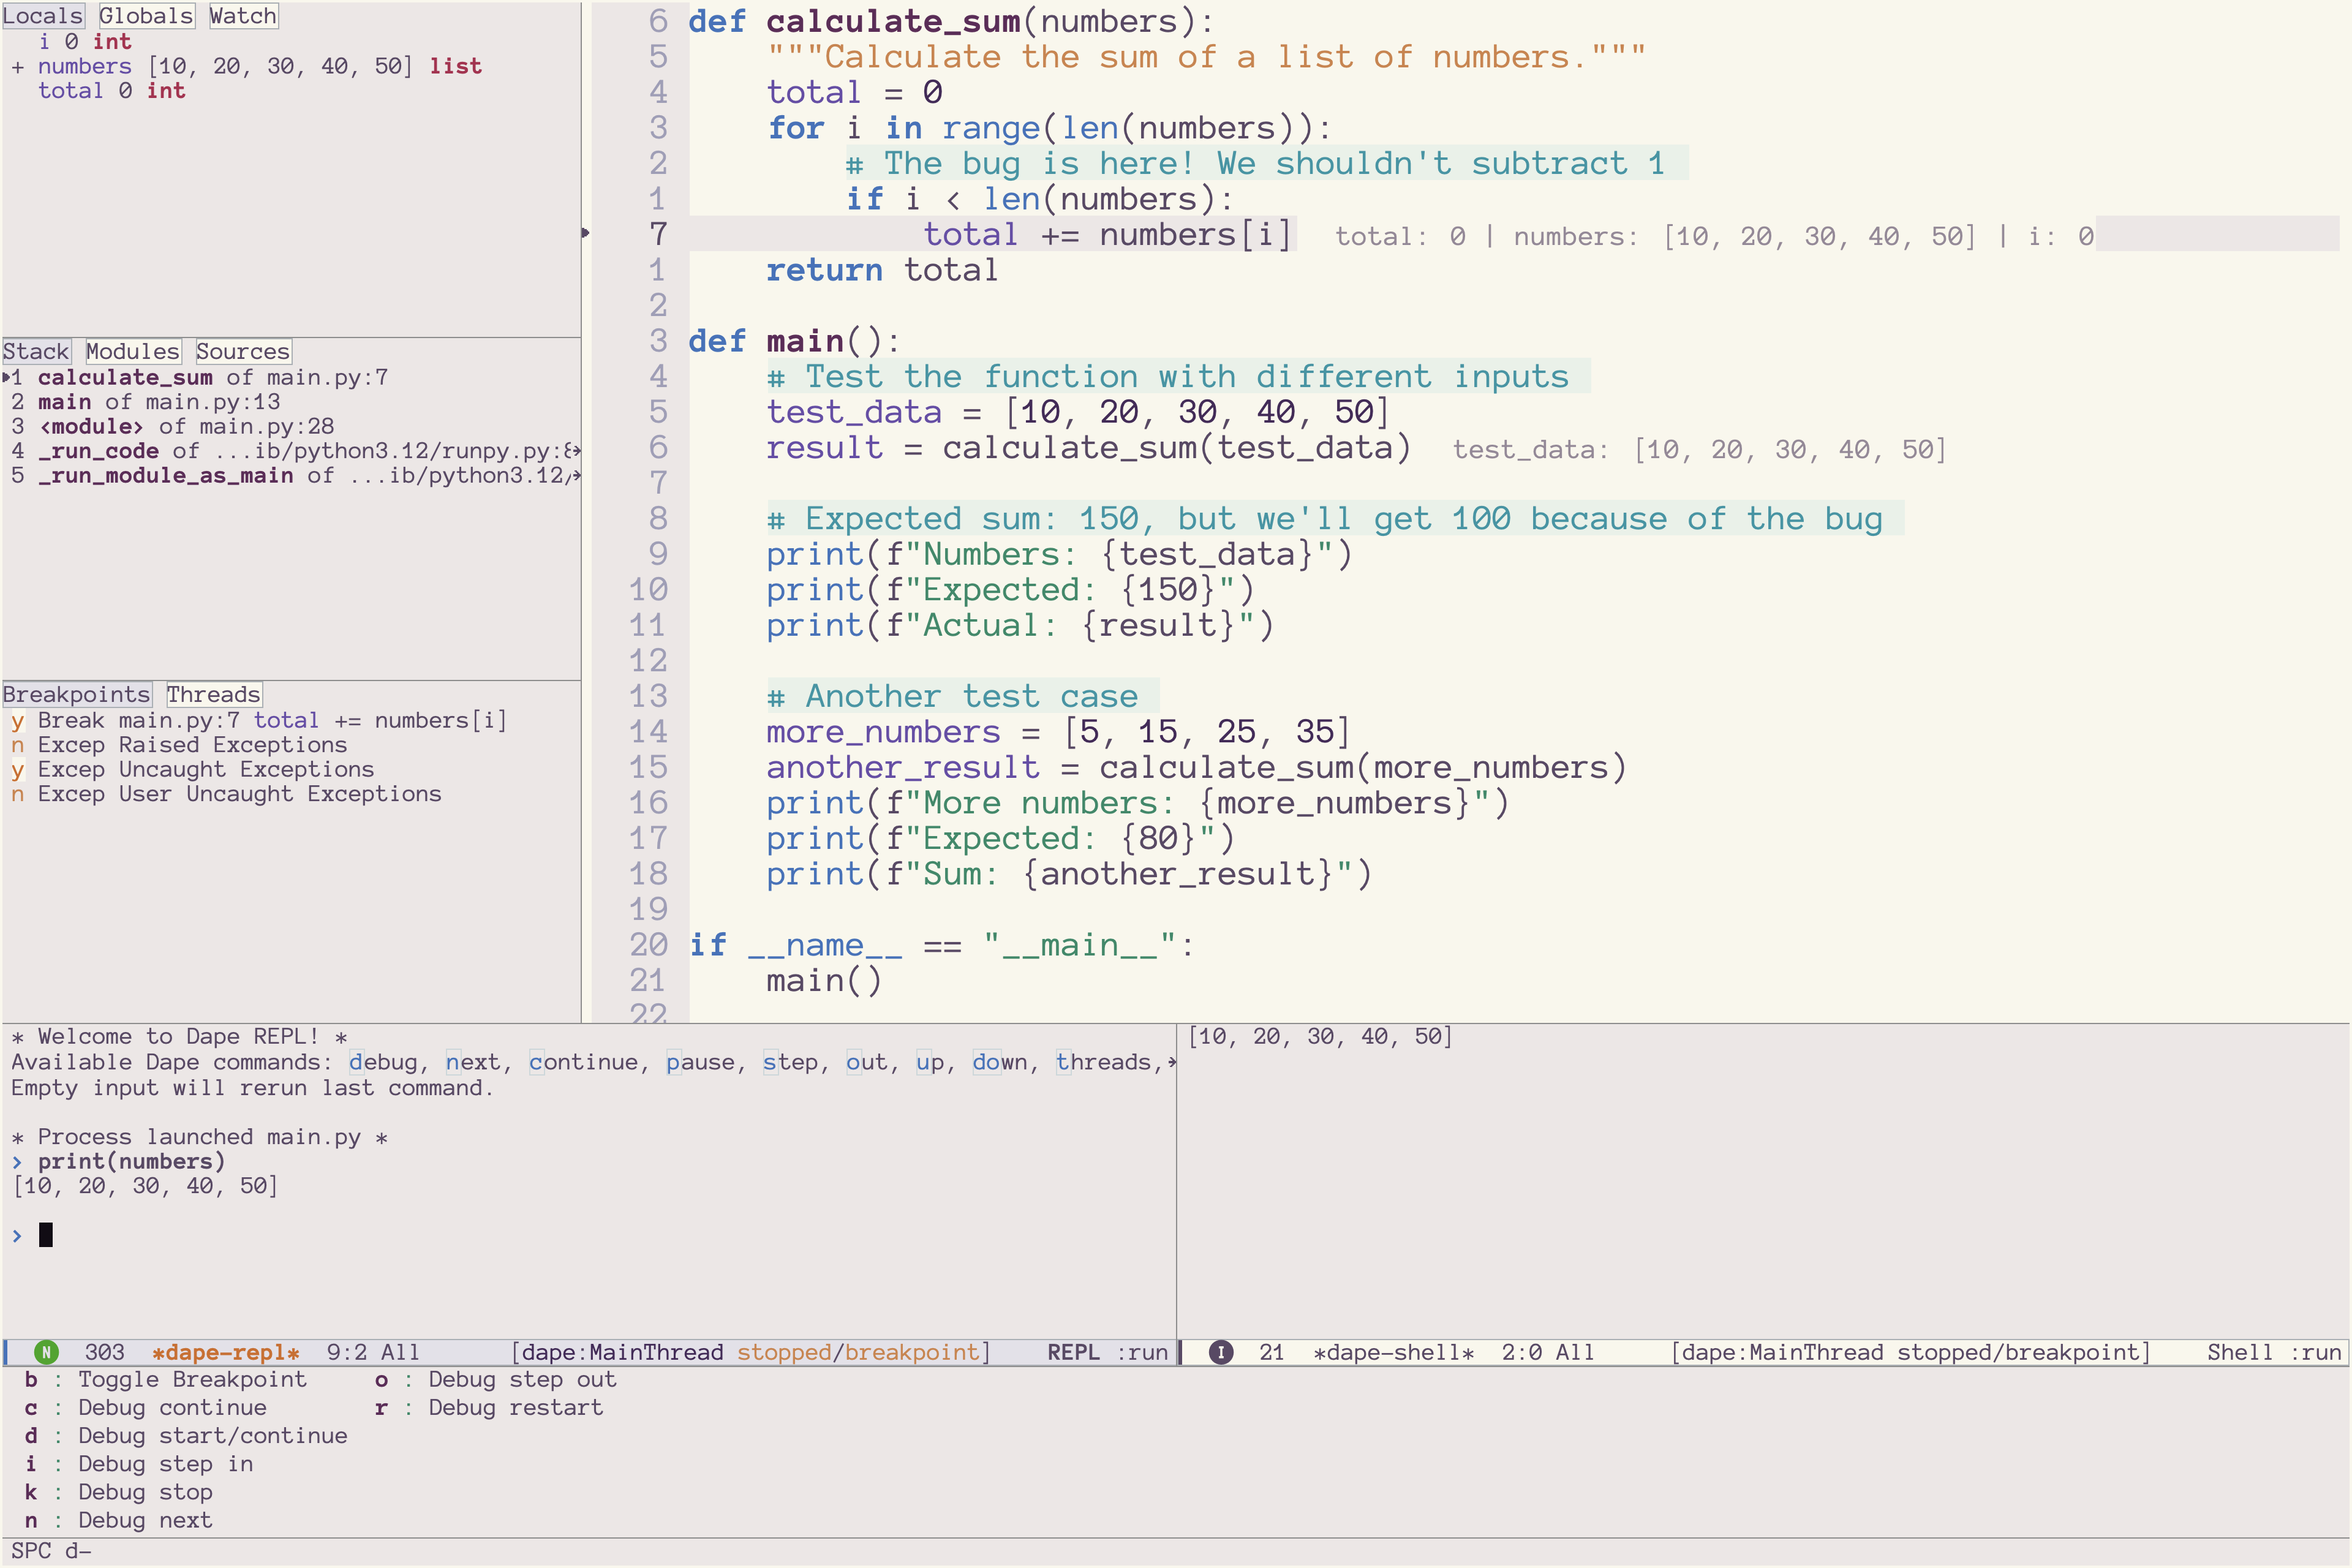
Summary
I hope you have a clearer sense of what a debugger is and how it works. Your actual projects or environments may be more complicated and present any number of challenges that you’ll need to overcome.
Hopefully though, this little bit of knowledge helps you find a path forward. Cheers
Disclaimers & Extra Tidbits
Programs can have different behavior when running via debugger
Some bugs “vanish” in a debugger (usually timing related ones)
Environment variables might need to be set separately for debugging
This is not true 100% of the time, but for most purposes it is close enough ↩︎